Search

Entries in Cost & Utilization (96)

Friday
May202022

Examining Unnecessary Medicare Patient Surgeries During First Year of Pandemic

by MCOL Staff, May 20, 2022

The nation’s hospitals performed more than 100,000 unnecessary and potentially harmful procedures on older patients between March and December 2020, according to a new analysis by the Lown Institute, a healthcare think tank. Coronary stents and back surgeries were among the most-performed unnecessary procedures over this period.

The analysis of Medicare claims data shows that thousands of vulnerable patients were admitted to U.S. hospitals during the height of the pandemic, before COVID-19 vaccines were approved, for procedures that offer little to no clinical benefit or were more likely to harm patients than help them. The analysis of eight unnecessary and potentially harmful procedures is the first to measure rates of overuse at U.S. hospitals during the COVID-19 pandemic.

“You couldn’t go into your local coffee shop, but hospitals brought people in for all kinds of unnecessary procedures,” said Vikas Saini, MD, president of the Lown Institute. “The fact that a pandemic barely slowed things down shows just how deeply entrenched overuse is in American healthcare.”

Volume of eight low-value procedures in U.S. hospitals per Medicare claims

  • Stents for stable coronary disease: 45,176 (42%)
  • Vertebroplasty for osteoporosis: 16,553 (16%)
  • Hysterectomy for benign disease: 14,455 (14%)
  • Spinal fusion for back pain: 13,541 (13%)
  • Inferior vena cava filter: 9,595 (9%)
  • Carotid endarterectomy: 3,667 (3%)
  • Renal stent: 1,891 (2%)
  • Knee arthroscopy: 1,596 (1%)
  • Total unnecessary procedures identified: 106,474

Coronary stents were the most overused by volume of all the procedures. Across the country, approximately one in five met criteria for overuse, including at some of the nation’s most well-regarded hospitals. For example, among the U.S. News top 20 hospitals, all had rates of coronary stent overuse above the national average, and four had rates at least double that: Cleveland Clinic (44%), Houston Methodist Hospital (44%), Mt. Sinai (42%), and Barnes Jewish Hospital (42%).

For this analysis, the Lown Institute used data from the 100% Medicare claims database from January – December 2020 to evaluate volume of overuse for eight common low-value procedures. Procedures and overuse criteria were based on Lown’s previously published research into measurement of low-value care at hospitals

Thursday
Aug192021

Utilization Drop in 2020 May Have Not Been as Much as Feared, and 2021 May be Seeing a Spike

By Clive Riddle, August 19, 2021

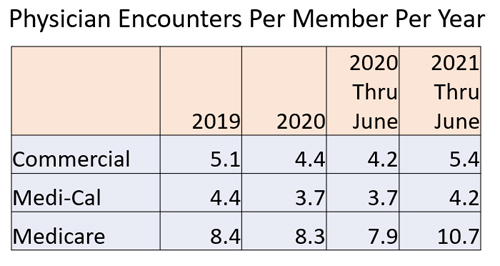
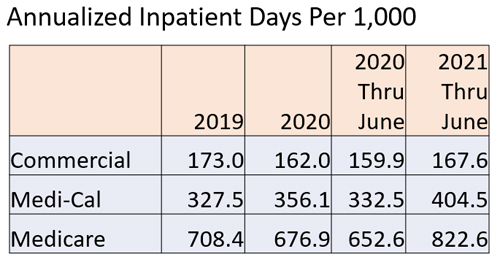
Analysis of California Health Plan data indicates 2020 physician encounters and inpatient days didn’t plummet as far as some worried earlier in the pandemic, due to deferred care, although as all aspects of everyday like opened up more in 2021, a spike in utilization was evidenced.  These findings are a preview of the complimentary webinar presentation:  California Health Plans By the Numbers: Key California Health Plan Data and Trends, to be held this Wednesday, August 25th at 10AM Pacific.

California health plan physician encounters per member per year dropped from 2019 to 2020 in all three segment populations: Commercial from 5.1 to 4.4, Medi-Cal from 4.4 to 3.7. and Medicare from 8.4 to 8.4. But all three segment have increased in 2021 through June (5.4, 4.2, and 10.7 encounters respectively), with Commercial and Medicare surpassing 2019 levels. The 2021 jump is even more pronounced compared to the first six months of 2020.

California inpatient days per 1,000 members experience was somewhat similar. Comparing 2020 to 2019, Commercial dropped to 162.0 from 173.0, and Medicare dropped to 676.9 from 708.4. However, Medi-Cal days per 1,000 increased in 2020, to 356.1 to, 327.5. This was likely somewhat due to effects from a marked increase in new Medi-Cal members in 2020 (927k net new members in 2020, almost a 10% increase.) 2021 days per 1,000 increased over 2020 levels for all three segments, and 2021 Medi-Cal and Medicare days were materially higher than 2019.

Come join us this Wednesday to find out more!

Tuesday
Apr142020

Four Questions for The Whyzen Team at Health Intelligence Company on Solving the Rubix Cube of Health Plan Benefit Design with Analytics

By Claire Thayer


Drs Mary Henderson and Russell Robbins from The Whyzen Team at Health Intelligence Company participated in a Healthcare Web Summit webinar: Solving the Rubix Cube of Health Plan Benefit Design with Analytics.  The discussion highlighted the greater need for near real-time, population-specific health benefits analytics.  The speakers addressed how Whyzen is helping health benefits stakeholders spot outliers and track variations from benchmarks over time with quick views of cost, quality, and utilization.

Additionally, with COVID-19 being top of mind for so many, Whyzen has added reporting capabilities that allow health plans, employers, brokers/consultants identify who and where their most vulnerable employees/members are. This targeted information empowers all users to better allocate care management resources for targeted and impactful interventions.

If you missed this engaging webinar presentation, you’ll want to be sure to watch the Webinar Video. After the webinar, we interviewed the speakers on four key takeaways: 


1. What are some of the ways that employers are mitigating out-of-network costs?

The Whyzen Team at HIC: While out-of-network costs are not the biggest driver of healthcare trends, they are definitely substantial – and largely avoidable. Employers are looking for solid data to provide support for alternatives and programs that comprise key elements of benefit design. Whyzen provides the analysis and justification for appropriate programs.

For starters, employers need to assess the extent to which out-of-network costs drive overall trends. Whyzen – from Health Intelligence Company (HIC) – can help them quantify the scope of the problem and identify where the saving opportunities lie.

For example, for elective surgeries (e.g., bariatric surgery, orthopedic surgery), Whyzen can identify the types of procedures that were performed, the volume of procedures, and whether they were done in or out of network. To avoid high rates charged by out-of-network providers, Whyzen enables employers to guide employees to Centers of Excellence or to align patients’ needs with more appropriate sites of service.


2. You mention that employers are telling you that only "data nerds" can get value out of reporting and analytics solutions. Can you tell us more?

The Whyzen Team at HIC: Frequently, companies that use analytics solutions find them to be cumbersome to navigate, time-consuming  to get to a decision point, and lacking  actionable recommendations at the end of the analysis. As a result, plans, employers, and brokers tend to hand that work off to data experts, thereby distancing their clinical, care management, and benefit design staff from data-driven insights. And data analysts may not understand the clinical, quality, or financial implications of their findings.

Solutions that are accessible, intuitive, and inclusive of many data sources allow users to spend less time analyzing and more time developing strategies and interventions. Health Intelligence Company designed its Whyzen employer reporting solution with those features in mind.


3. How does Whyzen differentiate itself from competing solutions? What are its key strengths and differentiators?

The Whyzen Team at HIC: Whyzen stands out as the industry leader for employer reporting and analytics for a number of reasons:

  •    Standard and Customized Reporting:
  •    Interactivity
  •    National Benchmarks
  •    Flexible Analytics
  •    Deep External Data Integration
  •    Flexibility / User Configurability


4. What types of  benchmarks can Whyzen produce?

The Whyzen Team at HIC: Whyzen utilizes HIC’s National Benchmarking Module (NBM) to provide a rich set of benchmarks. HIC draws on a dataset that contains over 200 million unique lives and over 20 billion healthcare claims. Employers, brokers, and third-party administrators can compare relevant, HIPAA-compliant healthcare performance metrics. Whyzen can examine and compare cost and utilization performance by: 

Geography

  •          National vs. regional vs. local
  •          Census region and division
  •          Region type (urban, suburban, rural, exurban, etc.)
  •          State, city, or ZIP Code

Industry

  •          Industry category
  •          Standard Industrial Classification (SIC) codes

Product

  •          Preferred Provider Organization (PPO)
  •          Health Maintenance Organization (HMO)

Account Size

  •          Small
  •          Mid-Market
  •          Large

By viewing data through geographic, industry, product, and account size lenses, users can easily:

  •          Compare employer accounts
  •          Drill into cost and utilization data
  •          Explore quality measures, health risk scores, and clinical episode components

HIC’s unmatched data set and rigorous analytic model offer customers the single best view into how their spending compares on any number of dimensions.

For more information on Whyzen or Health Intelligence Company – or to view our recent webinar, “Solving the Rubix Cube of Employee Benefit Design” – click here.

Friday
Feb212020

Ten Things to Know from HCCI's Health Care Cost and Utilization Report

by Clive Riddle, February 21, 2020

The Health Care Cost Institute has released its annual Health Care Cost and Utilization Report, now addressing 2018 data. The report "analyzes 2.5 billion medical claims to inform the public about trends affecting approximately 160 million U.S. individuals with employer-sponsored insurance." 

Here's ten takeaways from the 29-page report:

  1. Health care spending grew 4.4% in 2018, slightly above growth in 2017 of 4.2%, and the third consecutive year of growth above 4.0%.
  2. Total annual spending per person increased by 18.4%, from $4,978 to $5,892, between 2014 and 2018.
  3. Between 2014 and 2018, average prices rose by 15%. Growth in average prices was 2.6% between 2017 and 2018, the slowest rate over the period.
  4. Higher prices accounted for 74% of total spending increases above inflation over the 5-year period - an average of $453 per person.
  5. Increased utilization of medical services accounted for 21% of spending growth after inflation - an average of $130 per person. Utilization of medical services rose by 3.1% between 2014 and 2018. Most of that increase, 1.8%, occurred between 2017 and 2018.
  6. Professional Services averaged $1,985 per person, consuming 33.7% of spending. Outpatient Services averaged $1,662 per person, or 28.2% of spending. Inpatient Services averaged $1,128 per person, accounting for 19.1% of spending. Prescription Drugs averaged $1,118 per person, with 19.0% of spending.
  7. Of the four major categories, outpatient visits and procedures saw the highest 2018 spending increase (5.5%), followed by prescription drugs (4.7%), professional services (4.5%) and inpatient services (2.2%)
  8. Demographic shifts in the employer-insured population accounted for 4% of post-inflation spending growth over the 5-year period - an average of $27 per person.
  9. People with job-based insurance saw their out-of-pocket costs rise by an average of 14.5%, or $114, between 2014 and 2018. The average out-of-pocket spending increased to $907 per person.
  10. On average, Americans with employer-sponsored insurance spent $155 out-of-pocket on prescription drugs in 2018. Generic drugs accounted for 88% of all prescriptions. The average out-of-pocket price for generic drugs was less than 1/5 the average for brand-name drugs
Friday
Nov152019

Affordability and Coverage of Prescription Drugs for Seniors: A Gallup Poll and a KFF Study

by Clive Riddle, November 15, 2019

West Health and Gallup have just released results from a new survey on healthcare costs that found 13.4% of U.S. adults had “a friend or family member [who] passed away after not receiving treatment for their condition due to their inability to pay for it.” That percentage decreases with age: 16.9% under age 45, 12.4% between age 45 and 64 and 6.6% age 65%+  knew someone passing away.

That might seem counter-intuitive, given the greater frailty of seniors, but greater income levels compared to those under age 45, combined with stable coverage (Medicare) factor in. By income the percentages were 18.5% under $40k annually, 11.1% between $40k to $100k, and 9.1% over $100k.

Prescription drugs pricing was a particular focus in the survey, and “89% of U.S. adults report that drug prices are either ‘much higher’ or ‘somewhat higher’ than what consumers should be paying for them.” The survey found “28% of women vs. 18% of men have been unable to pay for prescription drugs;’ and that “medication insecurity skyrockets to 42% among those with annual household incomes of under $40,000.”

Today’s seniors have something the previous generation did not –the availability of  Medicare prescription drug coverage to help insulate from drug costs, and Kaiser Family Foundation has just released a new study: Medicare Part D: A First Look at Prescription Drug Plans in 2020.

Here’s eight things to know from KFF’s study:

  1. The average Medicare beneficiary will have a choice of 28 PDPs in 2020, a 29% increase from 2017
  2. A total of 948 PDPs will be offered in 2020, an increase of 202 PDPs since 2017.
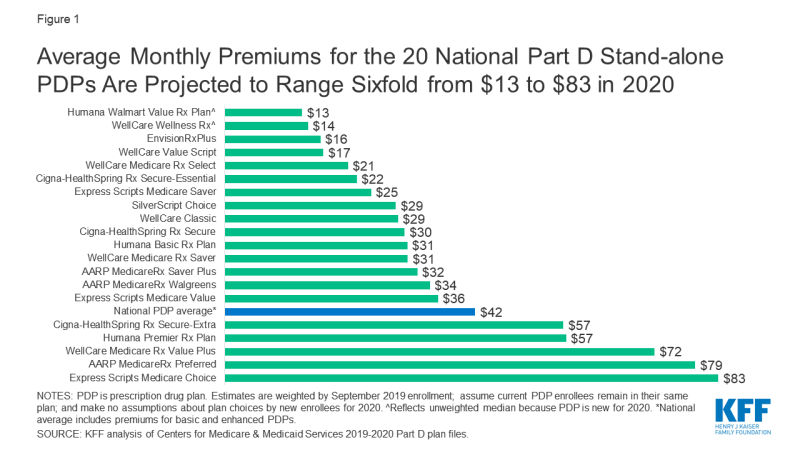
  3. Among the 20 PDPs available nationwide, average premiums will range sixfold from a low of $13 per month for Humana Walmart Value Rx Plan to a high of $83 per month for Express Scripts Medicare Choice.
  4. Two-thirds of Part D enrollees without low-income subsidies will have premium increases in 2020 if they stay in their same plan, and one-third will have premium decreases.
  5. The estimated national average monthly PDP premium for 2020 is projected to increase by 7% to $42.05
  6. In 2020, all PDPs will have a benefit design with five or six tiers for covered generic, brand-name, and specialty drugs, and cost sharing other than the standard 25% coinsurance, similar to 2019.
  7. 86% of PDPs will charge a deductible, with most PDPs charging the standard deductible of $435 in 2020.
  8. Among all PDPs, median cost sharing is $0 for preferred generics and just $3 for generics, but $42 for preferred brands and 38% coinsurance for non-preferred drugs plus 25% for specialty drugs
Friday
Sep202019

Health Plan Medical Ratio and Administrative Expense Snapshots

by Clive Riddle, September 20, 2019

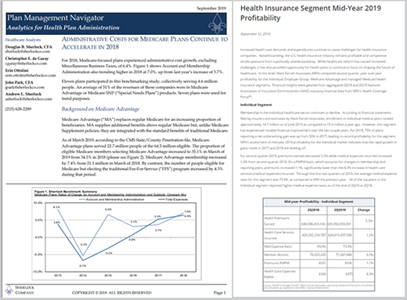
Two reports on health plan performance were released this week:  Mark Farrah Associates issued an analysis brief providing insights into mid-year profitability for commercial and government lines of health insurance business entitled: Health Insurance Segment Mid-Year 2019 Profitability; and Sherlock Company's September 2019 Plan Management Navigator summarized cost trends among Medicare-focused plans.

Key findings from the Mark Farrah report on health plan profitability include:

  • At the end of second quarter 2019, the average medical expense ratio for the Individual segment was 73.9%, as compared to 69.0% the previous year.
  • Growth in medical expenses pushed the average medical expense ratio for the Employer-Group segment up to 81.4% for 2Q19 from 80.5% in 2Q18.
  • For Medicare Advantage, premium growth outpaced increases in medical expenses pushing the medical expense ratio down to 84.7% from 85.5% in 2Q18.
  • An increase of 9.7% in medical expenses per member per month pushed the medical expense ratio for Managed Medicaid up to 92.0% from 88.8% in 2Q18.

Their report concludes “at mid-year 2019, all four health care segments are signifying reduced levels of profitability for health insurers over 2018.  Due to the minimum MLR constraints placed upon the individual segment, the stagnation of premium growth along with the rise in the mid-year med expense rations is not surprising, especially after the underwriting gains reaped in 2018.”

While Mark Farah Associates focused on profitability driven by medical expenses, Sherlock Company reported on administrative expenses and found that “for 2018, Medicare-focused plans experienced administrative cost growth, excluding Miscellaneous Business Taxes, of 6.4%. Account and Membership Administration [expenses were] also trending higher in 2018 at 7.0%, up from last year’s increase of 3.7%.

For Medicare-focused plans, they found “High cost Medicare Advantage grew at a median rate of 4.1%, Medicare SNP grew at a median rate of 5.7%, while low cost Medicaid increased at a median rate of 1.1%. The Commercial Insured product membership fell by a median rate of 2.1%, while Commercial ASO grew at a median rate of 3.5%. Overall, commercial membership decreased by 1.9%. Comprehensive membership in continuous plans fell by a median rate of 1.5%.

Friday
Sep202019

Health Plan Medicare Ratio and Administrative Expense Snapshots

by Clive Riddle, September 20, 2019

Two reports on health plan performance were released this week:  Mark Farrah Associates issued an analysis brief providing insights into mid-year profitability for commercial and government lines of health insurance business entitled: Health Insurance Segment Mid-Year 2019 Profitability; and Sherlock Company's September 2019 Plan Management Navigator summarized cost trends among Medicare-focused plans.

Key findings from the Mark Farrah report on health plan profitability include:

  • At the end of second quarter 2019, the average medical expense ratio for the Individual segment was 73.9%, as compared to 69.0% the previous year.
  • Growth in medical expenses pushed the average medical expense ratio for the Employer-Group segment up to 81.4% for 2Q19 from 80.5% in 2Q18.
  • For Medicare Advantage, premium growth outpaced increases in medical expenses pushing the medical expense ratio down to 84.7% from 85.5% in 2Q18.
  • An increase of 9.7% in medical expenses per member per month pushed the medical expense ratio for Managed Medicaid up to 92.0% from 88.8% in 2Q18.

Their report concludes “at mid-year 2019, all four health care segments are signifying reduced levels of profitability for health insurers over 2018.  Due to the minimum MLR constraints placed upon the individual segment, the stagnation of premium growth along with the rise in the mid-year med expense rations is not surprising, especially after the underwriting gains reaped in 2018.”

While Mark Farah Associates focused on profitability driven by medical expenses, Sherlock Company reported on administrative expenses and found that “for 2018, Medicare-focused plans experienced administrative cost growth, excluding Miscellaneous Business Taxes, of 6.4%. Account and Membership Administration [expenses were] also trending higher in 2018 at 7.0%, up from last year’s increase of 3.7%.

For Medicare-focused plans, they found “High cost Medicare Advantage grew at a median rate of 4.1%, Medicare SNP grew at a median rate of 5.7%, while low cost Medicaid increased at a median rate of 1.1%. The Commercial Insured product membership fell by a median rate of 2.1%, while Commercial ASO grew at a median rate of 3.5%. Overall, commercial membership decreased by 1.9%. Comprehensive membership in continuous plans fell by a median rate of 1.5%.

Friday
Jun212019

Ten Takeaways From PwC’s Medical Cost Trend Behind The Numbers 2020

By Clive Riddle, June 21, 2019 

PwC's Health Research Institute has just released their 14th annual report on medical cost trends: Medical cost trend: Behind the numbers 2020, which projects the 2020 trend to be a six percent cost increase. As PwC's HRI describes their 47-page report, they project "the growth of private medical costs in the coming year and identifies the leading trend drivers.... based on the best available information through June 2019. HRI conducted 55 interviews from February through June 2019 with health industry executives, health benefits experts and health plan actuaries whose companies cover more than 95 million employer sponsored large group members about their estimates for 2020 and the factors driving those trends. Also included are findings from PwC’s 2019 Health and Well-being Touchstone Survey of more than 550 employers from 37 industries as well as PwC HRI’s national consumer survey of 2,500 US adults."

Here’s Ten Takeaways from their 2020 report: 

  1. Small Uptick: The Medical Cost trend, still rounding to double digits in 2007 (11.9%) and 2008 (9.9%), trended downwards subsequently, to round to six percent since 2016 (6.2%), but have ticked up since the low-water mark of 5.5% in 2017 (and 5.7% in 2018-2019.)
  2. Price, Not Utilization: “Prices have been a larger component of employer benefit costs than utilization since 2004; utilization has hovered around zero percent growth since 2006. Utilization by individuals with employer-based insurance decreased by 0.2 percent from 2013 to 2017 while prices rose 17 percent during that time.”
  3. Impact of High Deductibles: “Average deductibles for employer-sponsored plans tripled between 2008 and 2018. This increase likely has led to a low utilization trend because employees are delaying or forgoing care due to their deductible.”
  4. Stall in HDHP Growth: “The shift to HDHPs by employers seems to have stalled. With 84 percent of employers offering an HDHP option in 2019 and a tight labor market, employers may not be as quick to push HDHPs in 2020.
  5. Acceleration in Retail Rx Spending: “Starting in 2020, retail prescription drug spending growth for private health insurance will begin to increase, hitting between 3 percent and 6 percent annually through 2027.24 The growth in spending can be attributed to the waning impact of generics on the market and the introduction of new drugs.”
  6. Specialty Drug Million Dollar Drugs Pipeline: The portion of total retail drug spending on specialty drugs continues to grow. “We are at an inflection point with drugs in the pipeline. We thought hep C was expensive at nearly $100,000 per treatment. Many drugs in the pipeline are life-altering and come with a price tag of $1 million to $2 million per treatment.”
  7. Growth in Chronic Disease Spending: "Spending by employers on individuals with chronic diseases is nearly quadruple [3.5x] that of healthy individuals while spending on individuals with complex chronic diseases is eight times higher" [8.2x].
  8. Growth in Onsite Clinics: “38 percent of large employers offered an onsite health clinic in 2019, up from the 27 percent that offered a clinic in 2014. An additional 13 percent said they were considering adding one.”
  9. Telehealth Potential: “49 percent of consumers with employer coverage said they are willing to use telehealth in place of an in-person visit.”
  10. Underutilized Wellness and Prevention programs: “For decades, employers have invested in health and wellness and prevention, yet participation remains low.....The small population of employees who participate in their employers’ health and wellness programs generally believe the programs have had a positive impact on their health.”


Friday
Dec072018

Premium and Deductible Cost Sharing: A Dozen Key Findings from the Commonwealth Fund

by Clive Riddle, December 7, 2018 

CMS has just touted the National Health Expenditure growth of 3.9% for 2017 is at historic low levels, with the Office of the Actuary stating “prior to the coverage expansions and temporary high growth in prescription drug spending during that same period, health spending was growing at historically low rates. In 2017, health care spending growth returned to these lower rates and the health spending share of GDP stabilized for the first time since 2013.” 

Meanwhile, The Commonwealth Fund paints a different picture from another perspective, and has just released a 21-page DataBrief: The Cost of Employer Insurance Is a Growing Burden for Middle Income Families, with lead author Sara Collins commenting “The cost of employer health insurance premiums and deductibles continues to outpace growth in workers’ wages. This is concerning, because it may put both coverage and health care out of reach for people who need it most — people with low incomes and those with health problems. Policies that would reduce health care burdens on employees include fixing the Affordable Care Act’s family coverage glitch, requiring employers to exclude some services from the deductible, and increasing the required minimum value of employer plans.” 

The Commonwealth Fund tells us their study uses “the latest data from the federal Medical Expenditure Panel Survey–Insurance Component (MEPS–IC) to examine trends in employer premiums at the state level to see how much workers and their families are paying for their employer coverage in terms of premium contributions and deductibles. We examine the size of these costs relative to income for those at the midrange of income distribution.” 

Here’s a dozen key findings: 

  1. Average employee premium contributions for single and family plans amounted to nearly 7 percent of U.S. median income in 2017, up from 5 percent in 2008. 
  2. In 11 states (Arizona, Delaware, Florida, Georgia, Louisiana, Mississippi, Nevada, New Mexico, North Carolina, Oklahoma, Texas), premium contributions were 8 percent of median income or more, with a high of 10.2 percent in Louisiana.
  3. Premium and deductible costs amounted to nearly 12 percent of median income in 2017. Added together, the total cost of premiums to workers and potential spending on deductibles for both single and family policies climbed to $7,240 a year in 2017. 
  4. This combined cost ranged from a low of $4,664 in Hawaii to a high of more than $8,000 in eight states (Alaska, Arizona, Delaware, New Hampshire, North Carolina, South Dakota, Texas, Virginia). 
  5. In two states, Mississippi and Louisiana, these combined costs rose to 15 percent or more of median income.
  6. Premiums for employer health plans rose sharply in nearly every state in 2017. After climbing modestly between 2011 and 2016, overall premiums for employer health plans (employer and employee share) grew more sharply in 2017, by 4.4 percent for single plans and 5.5 percent for family plans. 
  7. Annual single person premiums rose above $7,000 in eight states (Alaska, Connecticut, Delaware, Massachusetts, New Jersey, New York, Rhode Island, Wyoming) and family premiums were $20,000 or higher in seven states (Alaska, Connecticut, Massachusetts, New Jersey, New York, West Virginia, Wyoming) and the District of Columbia. 
  8. Average premiums for families increased overall in 44 states and the District of Columbia.
  9. As employer premiums have risen, so have workers’ contributions. Between 2016 and 2017, employee premium contributions rose by 6.8 percent to $1,415 for single-person plans and by 5.3 percent to $5,218 for family plans.
  10. Contributions for single plans increased in 32 states, ranging from a low of $675 in Hawaii to a high of $1,747 in Massachusetts. 
  11. Contributions for family plans rose in 35 states and the District of Columbia, with the lowest increase in Michigan ($3,646) and the highest in Delaware ($6,533).
  12. The average deductible for single policies rose to $1,808 in 2017, a 6.6 percent increase. Average deductibles rose in 35 states and the District of Columbia, ranging from a low of $863 in Hawaii to a high of about $2,300 in Maine and New Hampshire.


Friday
Oct262018

Two Reports on Cost Driven Deferred Medical Care

By Clive Riddle

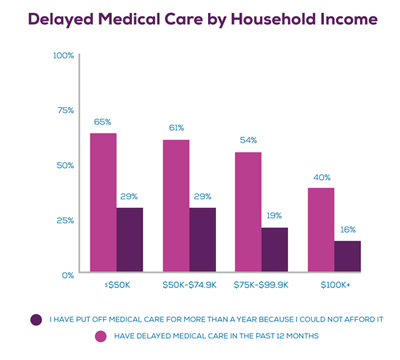
Two reports were published this week on deferred medical care driven by cost considerations, based on survey findings. Earnin’s report: Waiting to Feel Better: Survey Reveals Cost Delays Timely Care is based on two surveys – a commissioned online Harris Poll among over 2,000 U.S. adults and an Earnin poll of their users, “many of which live paycheck to paycheck.” AccessOne’s report: AccessOne Patient Finance Survey- Analysis on how healthcare costs impact is based on a survey conducted by ORC International of 693 people with at least $35,000 in annual household income, weighted by age, sex, geographic region, race and education.

Earnin tells that 54% of Americans “have delayed medical care for themselves in the past 12 months because they could not afford it, “ with the top three most delayed types of care being dental/orthodontic work (55%), eye care (43%), and annual exams (30%.) Earnin reports that “23 percen) have put off getting medical care for more than one year because they could not afford it. Among those whose household is living paycheck to paycheck or not making enough to get by, the rate of this extremely delayed care averages 36 percent. Nearly half of Americans (49 percent) say their health tends to take a back seat to other financial obligations.”


AccessOne reports that “Twenty-seven percent of households with children are likely to delay care because they can’t afford to pay for it.” Focusing on the dollar amounts involved and financing issues, they tell us that
  • 21% of families who had trouble paying their medical bill reported that their accounts had been sent to collections.
  • More than half of respondents were concerned about their ability to pay a medical bill of less than $1,000; with 35 percent being concerned about paying a bill that totals less than $500 – 20 times less than the average healthcare balance of a person in the U.S.
  • Only 21 percent of respondents said their healthcare providers have spoken to them about available patient financing options in the past two years.
  • Fifty-five percent of those surveyed said they prefer to discuss healthcare costs and financing options before care of service is delivered.
  • Fifty-four percent of those surveyed said they would use a no-interest financing option for a balance of $1,000 or less, and 57 percent said availability of a no-interest finance option is important or very important in evaluating a provider.
So if the AccessOne report implications bear out that improving financing options up front will reduce deferred medical care, the question is, will our younger generations that have had to assume much greater overall burden of college debt, also assume a growing burden of medical debt?


Friday
Jul132018

The Physician’s Role in Today’s Healthcare Costs

By Clive Riddle, July 13, 2018

Influencing consumer behavior to reduce healthcare costs via cost sharing and engagement strategies, and purchaser cost containment strategies of all stripes have seemingly dominated discussions of regarding the cost of healthcare. So how to physicians feel about their role in the cost equation today?

A new seven page NEJM Catalyst Buzz Survey report sponsored by University of Utah Health has just been released: Cost of Care and Physician Responsibility.   The report presents findings from the University’s survey examining how clinicians view health care costs. They “found that while clinicians feel a great sense of responsibility around keeping costs affordable for patients, they don’t feel they have the tools to know, the time to discuss, or the ability to impact how much things costs,” and furthermore “the survey results show a disconnect: Physicians feel responsible for the cost of care to a patient, but not accountable for it,”

99% of surveyed physicians said that out of pocket costs are important to patients – 62% said extremely important, 32% said very important and 5% said important.  Physicians were asked “Do the following aspects of cost enter into clinical decisions at your organization?” 76% said yes to Cost to practice/system; 72% said yes to Out-of-pocket cost for patients; 68% said yes to Total cost of care; and 36% said yes to Contribution to overall national health costs.

How much impact does each of the following stakeholders have on the cost of health care? The percentage of physicians saying each stakeholders had a strong impact were:

  •           Pharmaceutical/biotech companies  - 87%
  •           Health plans/HMOs/insurers – 81%
  •           Hospitals/health systems/physician organizations – 75%
  •           Government/regulators – 67%
  •           Individual clinicians – 60%
  •           Employers – 28%
  •           Patients – 26%
  •           Medical device manufacturers – 23%

The percentage of physicians agreeing with the following statements were as follows:

  •           Health care costs are too confusing with current payer mix – 90%
  •           Physicians aren’t trained to discuss the cost of care – 86%
  •           The tools necessary to estimate costs to the patient are not available – 78%
  •           Tools necessary to estimate costs to health care delivery system, not available –77%
  •           There isn’t enough time in clinic to discuss cost of treatments with patients – 64%
  •           Physicians should make the best treatment decisions irrespective of cost – 57%
  •           Physicians should be held accountable for the cost of care to a patient – 28%
  •           It’s not the physician’s responsibility to educate patients about costs – 18%

Current strategies involving physicians are focused at the organizational level, such as with value based care and accountable care arrangements. When you get at the individual level, these survey results indicate that it would seem there is a reason current cost strategies emphasize purchaser and consumer solutions.

Thursday
Jun072018

The 260 Page 2018 Annual Medicare Trustees Report and the Part D Rx Share of the Pie

By Clive Riddle, June 7, 2018


This week CMS released the 2018 Annual Medicare Trustees Report, which provides a financial/actuarial analysis of the current state of the Medicare Fund, and projections regarding the Fund solvency going into the future.  The big takeaway always emphasized from the report is at what year in the future will the Fund become insolvent, but there really is a lot of historical information in the report worth a gander.


In regard to when the Fund is projected down, we are told the “Trust Fund will be able to pay full benefits until 2026, which is three years earlier than last year’s projections, attributable to adverse changes in program income. The Trustees project that total Medicare costs (including both HI and SMI expenditures) will grow from approximately 3.7 percent of GDP in 2017 to 5.8 percent of GDP by 2038, and then increase gradually thereafter to about 6.2 percent of GDP by 2092.”


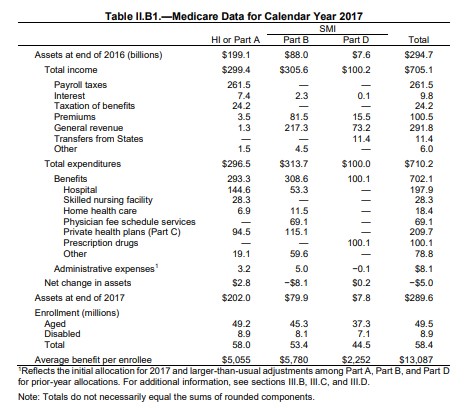
But in addition to the voluminous portion of the report dedicated to projections taking us to near the end of the century, there’s plenty of history and present tense buried in the 260 page report as well. Here’s a snapshot from the report of Medicare in 2017:

It’s interesting to look out what portion of the expenditures are from Part D. On a gross basis, $100.1 Billion in Prescription Drug expenditures out of $702.1 Billion in benefits represents 14.3% of benefit expenditures.


But not all beneficiaries have Part D coverage, so that’s not an apples to apples percentage.

Looking at 2017 benefits for Part A, Part B, Part C and Part D combined, total benefits were $702.1 Billion, of which 29.9% ($209.7 Billion) was spent through Part C, the Medicare Advantage program. Given the analysis doesn’t break down the benefit expenditure categories for the contracting Part C Medicare Advantage plans, here’s a breakdown of the Regular Medicare expenditures including Part D (backing out Part C):

  • Hospital:  43.6% ($197.9 Billion)
  • SNF: 6.2% ($28.3 Billion)
  • Home Health Care: 4.1% ($18.4 Billion )
  • Physician Fees: 15.2% ($69.1 Billion)
  • Prescription Drugs (gross adjusted): 13.5% ($61.6 Billion)
  • Other: 17.4% ($78.8 Billion)

Regarding the Gross Prescription Drugs adjustment: You will note the above Prescription Drugs total $61.6 instead of the $100.1 Billion in the above snapshot. That’s because the Medicare Advantage Part C enrollees with Part D enrollment were backed out, given that the other benefit expenditure categories didn’t include a breakdown from Part C. So the Part C enrollment in Part D plans, as a percentage of total Part D enrollment – taken from the December 2017 Medicare Advantage/Part D Contract and Enrollment Data Summary Report - was extrapolated (61.5% of Part D Enrollees are not enrolled in Part C; 61.5% of $100.1 Billion in total Prescription Drugs expenditures = $61.6 Billion.)


But the only problem with stopping there, is not all regular Medicare beneficiaries are enrolled in Part D. There were 43.2 million PDP enrollees at the end of 2107, while there are 58.5 million total Medicare beneficiaries. Of the 15.3 million 2017 beneficiaries with no Part D, 1.9 million were from Part C, leaving 13.4 million regular(non-part C)  Medicare beneficiaries with no Part D, and 26.2 million with Part D, out of a total 39.6 million regular Medicare beneficiaries. Now if we extrapolate 66% (26.2/39.6 million) for regular Medicare with Part D, from the other benefit expenditure categories (reducing the expenditures by one third for the other categories) we can get an apples to apples look.


This will reflect the percentage benefit expenditures extrapolated for Regular Medicare beneficiaries with Part D coverage:        


  • Hospital:  40.7% ($130.6 Billion)
  • SNF: 5.8%  ($18.7 Billion)
  • Home Health Care: 3.8% ($12.4 Billion )
  • Physician Fees: 14.2% ($45.6 Billion)
  • Prescription Drugs (net adjusted): 19.2% ($61.6 Billion)
  • Other: 16.2% ($52.0 Billion)


19.2% of the Medicare benefit pie for prescription drugs, get us a lot closer to the Milliman analysis just conducted for AHIP in the commercial population, which found Rx representing 23.3% of total costs including administration. If we add in the extrapolated portion (66%) of the $8.2 Medicare administrative expenses from the above snapshot, the regular Medicare prescription drug portion represents 18.9% including administration.

Friday
Jun012018

Anthem, IngenioRx and Taking a Total View of the Prescription Drug Trend

Anthem, IngenioRx and Taking a Total View of the Prescription Drug Trend
 

By Clive Riddle, June 1, 2018


In the crossover worlds of national pharmacy chains, PNMs and health plans, we have witnessed the emergence of CVS-Aetna , Cigna-Express Scripts, and the UnitedHealthGroup’s OptumRx fueled by its 2015 acquisition of Catamaran, plus the rumored Walmart Humana pairing. Meanwhile, Anthem took a somewhat different approach, starting their own PBM from scratch instead of acquiring or merging with someone on in the Rx aisle. Thus last October Anthem announced the launch of IngenioRx, which will assume Anthem’s PBM business when its current commitments expire in 2020.


IngenioRx, thus sidelined for another year and a half – and looking to improve its visibility while gearing up – just released just released a Drug Trends Report in the same style as other national PBM reports, not letting the fact that it not yet operational serve as a roadblock. Instead, they focused reporting on the current Anthem book of business that they will be serving.


With that in mind, here’s what they shared for Anthem’s 2017 commercial population, emphasizing they were examining the total drug trend, including medical benefit and prescription benefit utilization, unlike many reports from others that are only positioned to report on the prescription benefit experience:

·         21% of Anthem’s total drug spend was administered via the medical benefit,, and 79% via the pharmacy benefit. For specialty drugs only, the breakdown was 42% medical benefit and 58% pharmacy benefit.

·         Anthem’s total drug trend was 2.0%, comprised of -4.6% non-specialty drug spend and 9.9% specialty drug trend.

·         Anthem’s 2.0% total drug trend drivers included 5.6% inflation, 1.2% new drugs costs, -0.8% reduction in utilization, and -4.0% decrease in costs due to management approaches. For non-specialty drugs, inflation was 4.9%; for specialty drugs inflation was 6.5%.


Carving out the prescription benefit to independent PBMs in the health plan world created three inefficiencies: (1) inability to manage the total drug trend due to some drugs administered through the medical benefit, as IngenioRx points out; (2) doesn’t allow for optimal coordination of care between the prescription and medical treatment components; and (3) creates duplication of administrative resources required in administering eligibility and reporting for the two components.


If IngenioRx remained just an in-house PBM for Anthem, taking the total drug trend management view will be easier, But Anthem’s IngenioRx will be a stand-alone PBM, pursuing other business as well, and requiring its own separate administrative systems, making taking a total view for the Anthem book of business a little more challenging.

 
Friday
Apr062018

The PBM side of CVS

The PBM side of CVS
 

By Clive Riddle, April 6, 2018


Assuming the CVS acquisition of Aetna clears all final hurdles, perhaps the most attention given to the merged company is in respect to the retail synergies. But the CVS Caremark PBM also deserves considerable attention. After all, Cigna’s big merger recently announced with Express Scripts was purely a PBM play.


With that in mind, its interesting to poke through the just released 14-page CVS Health Drug Trend Report 2017. Similar to Express Scripts previously released 2017 report, the CVS Health report was certainly positive, and they touted that drug prices for clients  rose “at a minimal 0.2 percent, despite manufacturer price inflation near 10 percent.”


But it must be noted that the touted 0.2 percent increase was just for prices. There was 1.7% cost growth due to utilization, yielding a total pmpy drug trend in 2017 of 1.9%, still quite a positive trend.


Here is additional data CVS shared about their client experience in 2017:

·         While CVS drug price growth was 0.2%, the manufacturer AWP inflation rates were 9.2& for traditional brands, 8.3% for specialty brands, and 0.4% for generics.

·         The CVS generic dispensing rate was 86.1%.

·         CVS traditional and specialty brands accounted for 14% of prescriptions dispensed, but 69% of pharmaceutical spend.

·         The CVS specialty trend consisted of 3.7% price growth plus 9.2% utilization cost growth for a total 12.9% 2017 specialty trend.

·         CVS gross client costs pmpm were 108.42 pmpm in 2017 compared to $104.10 in 2016.

·         For CVS Clients with managed formularies, costs were $88.94 pmpm compared to $87.43 pmpm in 2016.

·         The managed formulary differential in overall drug trend for 2017 resulted in a 1.7% trend with managed formulary clients compared to 4.2% trend for other clients.

·         42 percent of CVS Health commercial PBM clients spent less on their pharmacy benefit plan in 2017 than they had in 2016.

·         For clients aligned with the company's managed formularies, drug price declined by 0.1 percent, in 2017, as compared to the overall 0.2 percent drug price growth.

·         Member out of pocket costs pmpm declined from $11.99 in 2016 to $11.89 in 2017.

·         In 2017 24% of members had zero out of pocket costs (no claims), 49.4% of members had out of pocket costs under $100, 14.6% had out of pocket costs between $100-$299, 5% had out of pocket costs between $300 - $499, 4.3% between $500-$599 and 2.7% above $1,000.

 
Friday
Sep082017

Health Care's Juicero Problem

Health Care's Juicero Problem
 

by Kim Bellard, September 8, 2017

Bad news: if you were still hoping to get one of the $400 juicers from Juicero, you may be out of luck. Juicero 
announced that they were suspending sales while they seek an acquirer. They'd already dropped the juicer's price from its initial $700 earlier this year and had hoped to find ways to drop it further, but ran out of time. 

Juicero once was the darling of investors. They weren't a juice company, or even an appliance company. They were a technology company! They had an Internet-of-Things product! They had an ongoing base of customers!

The ridicule started almost as soon as the hype. $700 -- even $400 -- for a juicer? The negative publicity probably reached its nadir in April, when Bloomberg 
reported people could produce almost as much juice almost as fast just by squeezing the Produce Packs directly.


Moral of the story: if you want to introduce products that have minimal incremental value but at substantially higher prices, you're better off sticking to health care.

Take everyone's favorite target, prescription drugs. As Donald W. Light 
charged in Health Affairs, "Flooding the market with hundreds of minor variations on existing drugs and technically innovative but clinically inconsequential new drugs, appears to be the de facto hidden business model of drug companies."

As with prescription drugs, we regulate medical devices looking for effectiveness but not cost effectiveness -- and we don't even do a very good job evaluating effectiveness in many cases, according to a 
recent JAMA study

Take robotic surgery, hailed as a technological breakthrough that was the future of surgery. A robotic surgical system, such as da Vinci, can cost as much as $2 million, but, so far, evidence that they produce better outcomes is 
woefully scarce

Proton beam therapy? It's one of the latest things in cancer treatment, an alternative to more traditional forms of radiation therapy, and is 
predicted to be a $3b market within ten years. The units can easily cost over $100 million to buy and install, cost patients significantly much more than other alternatives, yet -- guess what? -- not produce measurably better results

Last year Vox 
used 11 charts to illustrate how much more we pay for drugs, imaging, hospital days, child birth, and surgeries than other countries. Their conclusion, which echoes conclusions reached by numerous other analyses: "Americans spend more for health care largely because of the prices."

We not only don't get a nifty new juicer from all of our health care spending, we 
don't even get better health outcomes from it.   

Health care's "best" Juicero example, though, may be electronic health records (EHRs). Most agree on their theoretical value to improve care, increase efficiency, and even reduce costs. But after 
tens of billions of federal spending and probably at least an equal amount of private spending, we have products that, for the most part, frustrate users, add time to documentation, and don't "talk" to each other or easily lend themselves to the hoped-for Big Data analyses. 

Many physicians might, on a bad day, be willing to trade their EHR for a Juicero. 

Jonathon S. Skinner, a professor of economics at Dartmouth,
 pointed out the problem several years ago: "In every industry but one, technology makes things better and cheaper. Why is it that innovation increases the cost of health care?" 

So we can make fun of Juicero all we want, but when it comes to overpriced, under-performing services and devices: health care system, heal thyself first.

This post is an abridged version of the posting in Kim Bellard’s blogsite. Click here to read the full posting

 
Friday
Jun162017

A Dozen Takeaways From PwC’s Medical Cost Trend: Behind the Numbers 2018 Report

Untitled 1
 

By Clive Riddle, June 16, 2017


PwC’s Health Research Institute has released Medical Cost Trend: Behind the Numbers 2018, their twelfth annual report projecting the growth of private sector medical costs in the coming year and identifying the leading trend drivers. The findings are largely based upon PwC’s annual Health & Well-being Touchstone Survey results, which draws from responses of 780 employers from 37 industries, and have also just been released.


Here’s a dozen takeaways from this year’s 32 page Behind the Numbers report, and 114 page Touchstone Survey report:


1.       PwC’s HRI projects a 6.5 percent growth rate for next year, a half percentage point increase from the estimated 2017 rate.
 

2.       This growth rates steadily decreased from 11.9% in 2007 to 6.5% in 2014, and has fluctuated slighly above or below that figure since then
 

3.       PwCs provides this definition of their projected medical cost trend: the “increase in per capita costs of medical services that affect commercial insurers and large, self-insured businesses. Insurance companies use the projection to calculate health plan premiums for the coming year.”
 

4.       PwC's HRI has identified three major inflators expected to impact medical cost trend in the coming year: (A) Rising general inflation impacts healthcare. As the U.S. economy heats up, a rise in general inflation during 2016 and 2017 will likely put upward pressure on wages, medical prices and overall cost trend in 2018; (B) Movement to high-deductible health plans is losing steam. The wave of growth in high-deductible health plans, employers' go-to strategy in recent years to curb health spending, may be plateauing; and  (C) Fewer branded drugs are coming off patent. Employers may have less opportunity to encourage employees to buy cost-saving generics in 2018.
 

5.       PwC's HRI has identified two major deflators expected to impact medical cost trend in the coming year: (A) Political and public scrutiny puts pressure on drug companies. Heightened political and public attention could encourage drug companies to moderate price increases; and (B) Employers are targeting the right people with the right treatments to minimize waste. They are doubling down on tactics such as prescription quantity limits and exploring new technologies such as artificial intelligence to match people with the best treatment.
 

6.       The report also cites these healthcare drivers affecting the 2018 cost trend:  Technology and treatment innovation: Provider and Plan Consolidation; Government regulation; and Evolving Payment models.
 

7.       The report allocated these proportions of costs by component for 2018: Pharmacy 18%; Inpatient 30%; Outpatient 19%; Physician 29%; Other 4%
 

8.       The Touchstone Survey cites that “Medical plan costs have continued to increase, but employers expect that the rate of increase will start to slow. Plan design changes contributed towards slightly lower-than-expected increases in 2016;” and that “the average increase in 2016 was 6.8% before plan design changes and 3.6% after plan design changes. In 2017, participants expect to see a 6.0% increase before plan design changes and a 3.2% increase after plan design changes.”
 

9.       The Touchstone Survey notes that “participants appear to be in a "wait and see" mode – rather than considering broader and more transformational changes, they continue to use traditional cost-shifting approaches to control health spend;” and that “57% of participants expect to continue to increase employee contributions in the next three years, while 38% (29% for Rx) plan to increase employee cost-sharing through plan design changes.”
 

10.   The Touchstone Survey finds that “participants are increasing contributions in the form of surcharges for spouse, domestic partner and dependent coverage. This may be contributing towards a decrease in enrolled family size and slowing the rise in net employer spend.”
 

11.   The Touchstone Survey also finds that “participants are utilizing High Deductible Health Plans (HDHPs) more and Preferred Provider Organizations (PPOs) less, although PPOs remain more popular among employees. PPOs are the highest-enrolled plan 44% of the time, compared to 46% in 2016 and 60% in 2009. HDHPs are the highest-enrolled plan 34% of the time, up from 32% in 2016 and 8% in 2009.”
 

12.   The Touchtone Survey found that employer interest in population health is strong but private exchange interest is waning. They report that “79% offer wellness programs compared to 76% in 2016, and 63% offer DM programs compared to 56% in 2016;” while  “8% of participants are considering moving their active employees to a private exchange; 2% have already done so. Interest seems to have dropped off as the discussions on public exchanges and ACA have increased. However, 36% of participants who offer retiree medical coverage are considering moving pre-65 retirees to a private or public exchange.”


Friday
Jun092017

Centura Health Shares Strategies for Reducing Readmissions in Bundled Payment Arrangements

060917
 

By Clive Riddle, June 9, 2017


Two experts from Centura Health, the Colorado based healthcare system shared their organization’s strategies in reducing readmissions in bundled payment arrangements for total hip and knee replacements, as part of a panel presentation in a HealthcareWebSummit event held this week on “Advanced Strategies in Appropriately Reducing Bundled Payment Arrangement Readmissions.”


Centura’s Kristen Daley, Group Director – Value Based Programs, and Brenda Lewis, RN, MBA-HCM, CCM, ACM Group Manager – Care Coordination started by providing context from the literature for total hip arthroplasty (THA)  and total knee arthroplasty (TKA):

·         5.6% of THA and 3.3% of TKA require Readmission within 30 days of discharge

·         Unplanned Readmissions Costs for Medicare Patients = $17.5 Billion/Year

·         THA costs: $17,103/Readmission

·         TKA costs : $13,008/Readmission


Daley and Lewis reminded us that elevated patient risk factors for these readmissions come from increased age; male gender; african american race; and medical co-morbidities including obesity,

chronic pulmonary disease, bleeding disorders, cancer history, and psychiatric illness.


They cited the leading complication for readmissions is infection: (12.1% of unplanned 30 day readmission) and the many other causes including: systemic: pulmonary, cardiac and circulatory; joint specific:  dislocation, fracture, malposition; hematoma, falls; failure to mobilize; increased pain and

social determinants. They noted 50% of these readmissions are unrelated to the patient’s index arthroplasty.


Here is Daley and Lewis’ summary of their readmissions reduction strategies:

·         Team Approach: All Providers and Caregivers Engaged, Communicating, and on the same page

·         Every Patient receives preoperative medical evaluation/optimization by Perioperative Hospitalists

·         Perioperative Hospitalists round post-op and collaborate on discharge with the Surgeon

·         Robust Care Coordination Program

·         Prepare Patients for Efficient Discharge

·         Front-Load Discharge Planning

·         Partner with Acute Case Management Team

·         Promote use of Preferred Partners

·         Extend Patient Management Post-Discharge


They have undertaken the following to prepare patients for the transition from hospital to home:

·         Begin Education Preoperatively and Re-emphasize throughout Hospitalization

·         Embed Care Coordinator into Joint Education Class

·         Utilize LACE Tool to Assist to Identify Risk of Readmission (The LACE index identifies patients that are at risk for readmission or death within thirty days of discharge)

·         Provide Detailed Discharge Instructions

·         Educate patients on Wound Care, DVT Signs

·         Help patients with understanding Pain Management

·         Emphasize importance of Post-op Rapid Mobilization and Physical Therapy

 
Thursday
May182017

Investing in an Index Fund tied to the Milliman Medical Index instead of the Dow Jones Industrial Average

By Clive Riddle, May 18, 2017

Milliman has just released their 2017 Milliman Medical Index, which measures the cost of healthcare for a typical American family of four receiving employer PPO coverage. The total family bill is $26,944 compared to $4,518 in 2001. I want to invest in an index fund tied the Milliman Medical Index. The annual rate of return since 2001 would be 11.805%, compared to 3.874% for the Dow Jones Industrial Average during that same time (Dow Jones May 16 2001: 11,215.92; Dow Jones May 16 2017: 20,606.93). Our Milliman Medical Index fund would outperform the Dow index fund by three times.

But since the Milliman index fund only exists in some alternate universe for now, we might as well dive into some of findings Milliman shares in their 12-page report on this year’s index: 


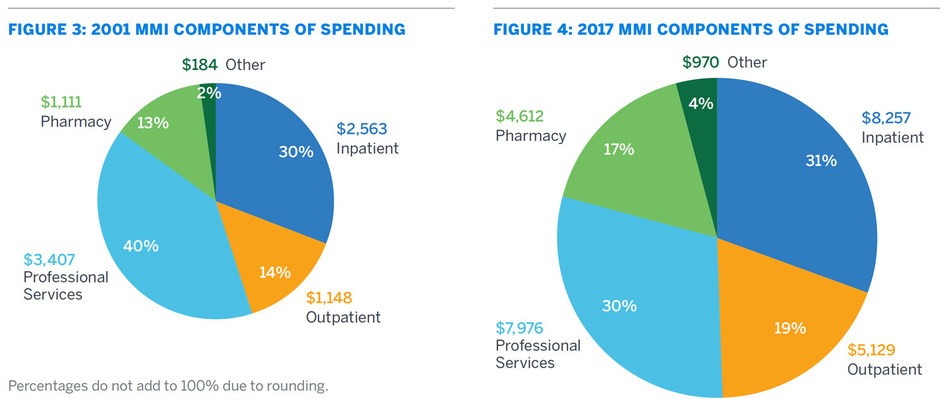
Pharmacy share of costs have increased during this this time (from 13% to 17%) as have Outpatient (from 14% to 19%) while Professional services decreased (from 40% to 30%) and Inpatient remained about the same (from 30% to 31%).

Here verbatim are Milliman’s three key findings:

1. The MMI’s annual rate of increase is 4.3%. This is the lowest rate since we began tracking the MMI in 2001. Yet the total dollar amount is still bracingly high. Of the $26,944 spent by the MMI’s family of four, $11,685 is paid by the employee, through a combination of $7,151 in payroll deductions for premium, and $4,534 in out-of-pocket costs incurred at time of care.


2. Prescription drug trends are lower, but still high. For the first time since 2013 and 2014, the family of four’s prescription drug trends have decreased in two consecutive years. Still, the 2017 prescription drug cost increase of 8% is more than double the medical increase of 3.6%.


3. Employees pay a bigger piece of the healthcare cost pie. Through their payroll deductions and through out-of-pocket expenses incurred when care is received, employees now pay for about 43% of expenses and employers pay the other 57%. The difference between these two shares has gradually narrowed since 2001, when employees contributed 39% and employers contributed 61%. High growth in per-employee healthcare expenditures have pushed employers to limit their contribution increases to amounts below the rate of healthcare inflation.


Thursday
Apr272017

What Goes into Combating Healthcare Fraud

Untitled 1
 

By Claire Thayer, April 27, 2017

According to the National Health Care Anti-Fraud Association, most health care fraud is committed by organized crime groups and a very small minority of dishonest health care provider. The NHCAA tells us that the most common types of fraud include:

·         Billing for services that were never rendered-either by using genuine patient information, sometimes obtained through identity theft, to fabricate entire claims or by padding claims with charges for procedures or services that did not take place.

·         Billing for more expensive services or procedures than were actually provided or performed, commonly known as "upcoding"-i.e., falsely billing for a higher-priced treatment than was actually provided (which often requires the accompanying "inflation" of the patient's diagnosis code to a more serious condition consistent with the false procedure code).

·         Performing medically unnecessary services solely for the purpose of generating insurance payments.

·         Misrepresenting non-covered treatments as medically necessary covered treatments for purposes of obtaining insurance payments-widely seen in cosmetic-surgery schemes, in which non-covered cosmetic procedures such as "nose jobs" are billed to patients' insurers as deviated-septum repairs.

·         Falsifying a patient's diagnosis to justify tests, surgeries or other procedures that aren't medically necessary.

·         Unbundling - billing each step of a procedure as if it were a separate procedure.

·         Billing a patient more than the co-pay amount for services that were prepaid or paid in full by the benefit plan under the terms of a managed care contract.

·         Accepting kickbacks for patient referrals.

·         Waiving patient co-pays or deductibles for medical or dental care and over-billing the insurance carrier or benefit plan (insurers often set the policy with regard to the waiver of co-pays through its provider contracting process; while, under Medicare, routinely waiving co-pays is prohibited and may only be waived due to "financial hardship").

While the U.S. Department of Justice, FBI, CMS and other government entities are busy identifying and tracking down fraud schemes, Deloitte research points out that an emerging area of interest in health care fraud and abuse enforcement is that of relationship scrutiny.

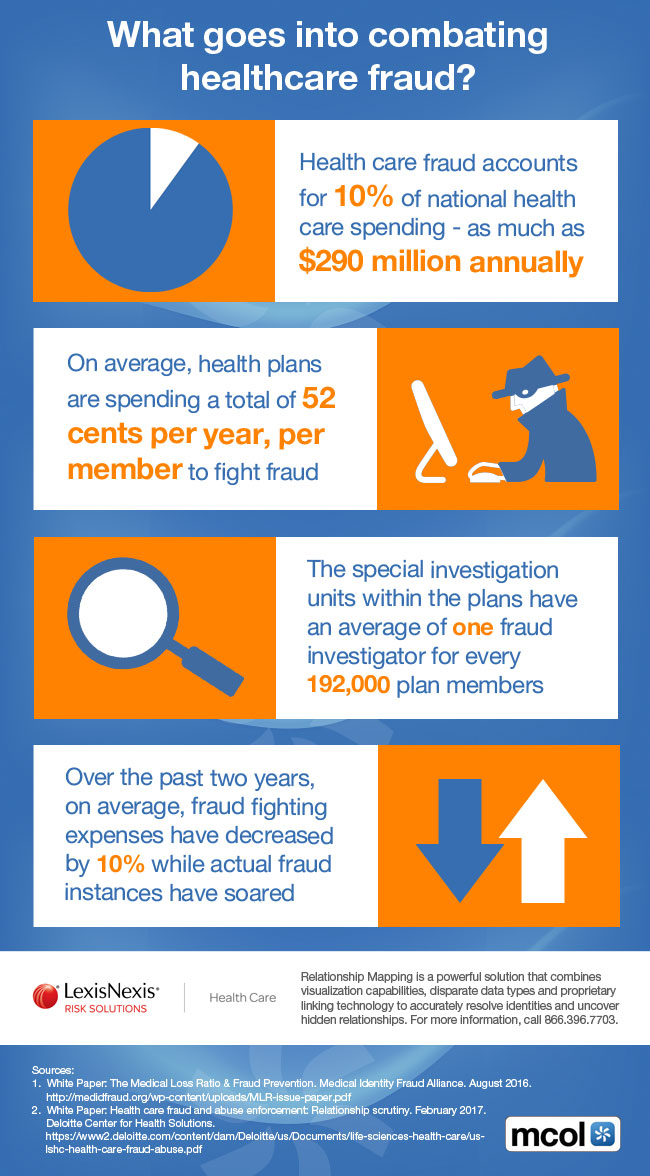
This weeks’ edition of the MCOL Infographic, co-sponsored by LexisNexis, highlights some of the costs associated with fighting healthcare fraud:

(Click to View Full Size Image)

What goes into combating healthcare fraud?

(Click to View Full Size Image)


MCOL’s weekly infoGraphoid is a benefit for MCOL Basic members and released each Wednesday as part of the MCOL Daily Factoid e-newsletter distribution service – find out more
here.

 
Friday
Apr142017

Reducing Emergency Visits and Admissions for Epilepsy Patients: Nationwide Children’s Dr. Anup Patel Answers Our Questions

Untitled 1
 

By Clive Riddle, April 14, 2017


What can a single quality improvement project accomplish at a single hospital? Just ask Nationwide Children’s, who  performed a quality improvement project and found new, simple ways to significantly decrease the number of emergency department visits and hospitalizations in pediatric patients with epilepsy.” They achieved a 28% decline in emergency visits, a 43% decline in admissions and saved $2 million in costs for these patients.


By sharing their research findings in the current issue of Pediatrics, and highlighted in Nationwide Children’s research publication Research Now, hospitals, physicians and purchasers performing care management can adopt Nationwide’s approach to their own settings.


We are told that “Nationwide Children’s Hospital serves almost 3,500 children diagnosed with epilepsy. In 2012 and much of 2013, the Emergency Department was experiencing approximately 17 visits per 1,000 epilepsy patients per month. In the minds of both Emergency Medicine physicians and epilepsy subspecialists, that was too many.”


The hospital shares that “the QI team identified ‘key drivers’ (or contributing factors) of ED visits, and found they centered on provider-to-provider communication issues and patient/family resources, education, beliefs and comorbidities. Then the team began interventions to target those key drivers. Most important was the establishment of an Urgent Epilepsy Clinic,” which they tell us involved family visits lasting 90 minutes or longer, with as little as three days’ notice.


Nationwide Children’s also identified that “abortive seizure medication was under dosed (or not given at all). Nationwide Children’s built an alert system into its electronic health records – when a provider entered what appeared to be an incorrect dosage based on size and age, the provider would be notified of the proper dose.”  Their additional interventions developed from the project included a color-coded seizure action plan, which helped caregivers understand what a baseline seizure looks like and when to call Neurology; and a personalized magnet giving caregivers information about how to give abortive seizure medications.”


The results? Emergency visits reduced from 17.0 to 12.2 per month per 1,000 children epilepsy patients during the past year. The average number of inpatient epilepsy children hospitalizations per month was reduced from 7 admissions per month per 1000 patients to 4 admissions per month per 1000 patients. 

Anup Patel, MD, a pediatric epileptologist and member of the Division of Neurology at Nationwide Children’s, and leader of the QI project and resulting research paper was nice enough to respond to some follow-up questions I asked after reading about the project.


First, I asked  him what is the approximate epilepsy incidence/1,000 population (pediatric preferably). He shared this information from Epilepsy.com which he recommends as a great source information on epilepsy:


Epilepsy is the 4th most common neurological problem – only migraine, stroke, and Alzheimer’s disease occurs more frequently. There are many different ways to explain how often a disease occurs. Here’s a few points to consider.

What is the incidence of epilepsy in the United States?

·         The average incidence of epilepsy each year in the U. S is estimated at 150,000 or 48 for every 100,000 people.

·         Another way of saying this- each year, 150,000 or 48 out of 100,000 people will develop epilepsy.

·         The incidence of epilepsy is higher in young children and older adults. This means that epilepsy starts more often in these age groups.

·         When the incidence of epilepsy is looked at over a lifetime, 1 in 26 people will develop epilepsy at sometime in their life.

·         Seizures are the number on most common Neurologic Emergency that we see in children.

What is the prevalence of epilepsy in the United States?

There are many different estimates of the prevalence of epilepsy. These numbers vary depending on when the studies were done, who was included, and a host of other factors.

·         The number of people with epilepsy, using prevalence numbers, ranges from 1.3 million to 2.8 million (or 5 to 8.4 for every 1,000 people).

·         The estimate currently thought to be most accurate is 2.2 million people or 7.1 for every 1,000 people.

·         However, higher numbers of people report that they have active epilepsy, 8.4 out of 1,000 people. These numbers are even higher when people are asked if they have ever had epilepsy (called lifetime prevalence). 16.5 per 1,000 people reported that they had epilepsy at some point in their life.


Next I asked him about the second intervention in the project regarding abortive seizure medication under dosed or not given. How much is medication adherence/compliance an issue for this population?  Dr. Patel responds that “We know that medication adherence to daily seizure medications is a risk factor for ED visits in patients with epilepsy.  In regards to abortive seizure medication (medication given for long or repeat seizures), we found under dosing was an issue (previous literature – Patel in Epilepsy and Behavior 2014) and that parents were either anxious, did not remember, or did not get proper instruction on how to give medications.”


Noting that the project identified comorbidities as a key driver, I asked him what are the typical comorbidities? He replied “Developmental delay, autism, cerebral palsy, depression, and anxiety.”

I asked Dr, Patel to elaborate on the calculation that their interventions yielded $2 million in annual savings. He responded that “our average ED visit was $640 and a subsequent hospitalization averaged $14,500 in claims paid. When you look at the reduction of both ED visits and the hospitalizations associated with the ED visit, you get the $2 million savings per year”.


Lastly, I asked if a similar approach work for an adult population as well. The short answer is yes.