Search

Entries in Cost & Utilization (96)

Friday
Apr072017

Health Plans and the Opiod Abuse Crisis

Untitled 1
 

By Clive Riddle, April 7, 2017


The Associated Press reports that Dr. Scott Gottlieb, “the doctor nominated to head the powerful Food and Drug Administration told senators Wednesday that his first priority would be tackling the opioid crisis.” 


What are health plans doing about Opiod Abuse? Last June, the California Health Care Foundation released  a report taking the issue on: Changing Course: The Role of Health Plans in Curbing the Opioid Epidemic, along with companion California health plan case studies and an infographic. Nationally, last fall AHIP weighed in, discussing how health plans are Fighting Opioid Abuse With Solutions That Work.


So what are some current developments on the health plan Opioid Abuse front?


Cigna has just announced that Use of Prescribed Opioids Down Nearly 12 Percent Over 12 Months Among Cigna Customers. Cigna reports that “58 medical groups participating in Cigna Collaborative Care, representing nearly 62,000 doctors, have signed Cigna's pledge to reduce opioid prescribing and to treat opioid use disorder as a chronic condition.”


Cigna states that their program works with participating doctors to: (1) Analyze integrated claims data across pharmacy and medical benefits to detect opioid use patterns that suggest possible misuse by individuals, and then notifying their health care providers; (2) Alert doctors when their opioid prescribing patterns are not consistent with CDC guidelines; and (3) Establish a database of opioid quality improvement initiatives for doctors.


Cigna also reports that “effective July 1, most new prescriptions for a long-acting opioid that are not being used as part of treatment for cancer or sickle cell disease, or for hospice care, will be subject to prior authorization, and most new prescriptions for a short-acting opioid will be subject to quantity limits.”


Last week the Wisconsin Association of Health Plans announced their member plans have jointly committed to combating opioid abuse and addiction in Wisconsin and effective April 1, Wisconsin's community-based health plans are collaborating on new initiatives.  The Association members agreed to: (1) support the Association’s Statement of Principles for addressing opioid abuse  that “form the basis for sharing information, best practices and evidence-based strategies”; (2) Track morphine equivalent dose and first-time user trends for their individual and employer group members,, generating comparative data to enrich provider education and management of prescription drug formularies and coverage policies; (3) Work with provider partners to support strategies to reduce and control the level of opioid prescribing; (4) Share methodologies, best practices and evidence-based strategies to improve the quality of pain management and opioid prescribing; and (5) Ensure that every member suffering from opioid abuse has access to medically-appropriate treatment options.


Two weeks ago BlueCross BlueShield of Western New York released episode four of their Point of Health Audiocast, “Addressing the Opioid Epidemic from a Health Plan Perspective,” aimed at increasing awareness of the issue and engaging stakeholders.


FamilyCare Health, a health plan serving Oregon Medicaid and Medicare members, “kicks off its 4-part Opioid Training series for providers on Thursday, April 27, 2017 with ‘Buprenorphine: What we know and what we don’t. Prescribing safely for pain management and opioid dependence.’ “


And last week, Prime Therapeutics, the Blue Cross Blue Shield Association PBM, released two studies, highlighting strategies for addressing opioid epidemic.  The first study “analyzed concurrent use of opioids with benzodiazepines”, citing “previous research has shown concurrent use of these two types of drugs can increase the risk of overdose and death,” and “found more than one in six opioid users without cancer – or nine per 1,000 commercially insured members – used these two drugs concurrently for 30 days or more in 2015.” Their second study “found pharmacists based in a PBM or health plan, who do outreach to prescribers, can reduce emergency room visits and controlled substance drug costs among persistent users of controlled substances.” Following the outreach conducted with the study intervention group, “controlled substances drug costs per member for the intervention group dropped from $5,802 to $5,148, while controlled substance drug costs increased for the control group from $3,511 to $3,627 per member. Emergency department visits were 6.4 percent lower in the intervention group, compared with the control group.”

 
Wednesday
Dec142016

Just Doing Our Jobs

by Kim Bellard, December 14, 2016


Health care fraud is bad.  Everyone agrees about that (except those who profit by it).  We'd similarly agree it is all too pervasive.   Some estimate that fraud could account for up to 10% of health care spending.  But that's chump change: estimates are that other kinds of wasteful spending, such as unnecessary care and excessive administrative costs, are easily double that

An op-ed in The Boston Globe may have it right:  we need an overdiagnosis awareness month.The op-ed was a tongue-in-cheek suggestion to highlight the various cancer awareness months, the most famous of which is October's Breast Cancer Awareness.  These campaigns promote the need for the associated screenings, but don't typically also mention how controversial many of them are.  

 
Overdiagnosis goes much further than screenings.  As Atul Gawande 
wrote last year, we're getting an "avalanche of unnecessary care," getting too many services of not just low value but of at best no value to patients -- and, at worse, actually harmful to them.  Not just pointless tests or unneeded prescriptions, but also too many questionable procedures, such as total knee replacementsheart stents, or spinal fusions

The real problem is that most people involved in the "
epidemic" of overdiagnosis and over-treatment our health care system, well, they think they're just doing their jobs. 

They don't think they're trying to rip anyone off, they certainly don't think that they're harming anyone, and they most definitely don't think their role is superfluous.  This is all only possible because it is still too hazy about what is the right treatment for who, when, not to mention what a "fair" price might be for anything.  So, when in doubt, do more.

As a result, health care employment is booming.  
Some project it will be largest job sector within three years.  Indeed, as the chart below shows, virtually all of the U.S. job growth this century has been in health care jobs.  That, quite simply, is astounding. 


Yet, despite all this growth, there continue to be 
urgent cries of shortages of key health care professionals.  We just cannot seem to get enough qualified health care workers.  If you're looking for a job, that's good news, but if you're paying the bill for all those jobs, it should be scary.

In health care, we just add more jobs.

Overtreatment works, at least if you're the one doing the treating.

And everyone in health care keeps doing their job.

Look, this fantasy isn't going to continue.  Health care isn't going to become 100% of GDP.  It's not going to get to 50%, or 40%.  At some point the revolt will happen, the revolution will occur, and health care spending will finally slow, stop, and eventually plunge. 

Then all those health care jobs are not safe.  People will lose their jobs.  A lot of people.  People who, until then, thought they were doing good.

So when the next health care innovator comes along, we should try to get past the hype and ask: OK, specifically, what jobs will this eliminate -- which ones, how many, when?  If they don't have answers, or only offer vague promises, well, smile politely and get out your wallet.

In health care, perhaps one way to do your job might just be to find a way to eliminate it.


This post is an abridged version of the posting in Kim Bellard’s blogsite. Click here to read the full posting

Friday
Sep302016

Prescription Drug Costs on the Public’s Mind – Reductions in the Uninsured Not So Much

By Clive Riddle, September 30, 2016

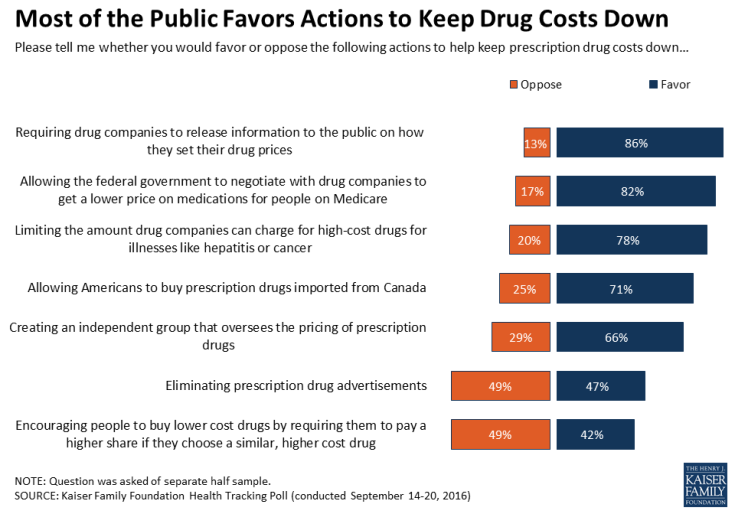
The just released current Kaiser Family Foundation Tracking Poll finds that while the public continues to be deeply divided on the Affordable Care Act, they are fairly united in backing policy changes to rein in prescription drug costs. The level of bipartisan public support – powered by recent EpiPen pricing headlines among other Rx cost woes in the news -  would seem to offer a prescription paving the way for a rare event these days– legislation that has a chance of being enacted into law when the new Congress convenes next session.

There is widespread agreement on five policy points:

  1. 86% support requiring drug companies to release information to the public on how they set drug prices
  2. 82% favor allowing the federal government to negotiate with drug companies to get a lower price on medications for people on Medicare
  3. 78% approve of limiting the amount drug companies can charge for high-cost drugs for illnesses like hepatitis or cancer
  4. 71% like allowing Americans to buy prescription drugs imported from Canada
  5. 66% want an independent group that oversees the pricing of prescription drugs

Here’s a graphic Kaiser Family Foundation provided regarding the poll results:


The survey finds that “a large majority (77%) perceive drug costs as unreasonable, while one in five (21%) say they are reasonable. The share who say drug costs are unreasonable is up somewhat from 72 percent a year ago in August 2015.”  The Survey also finds that “about half (55%) of the public report currently taking prescription drugs, and the vast majority (73%) of them say paying for their medications is easy; far fewer (26% of those taking prescription drugs, or 14% of the total population) say it is difficult to pay for their drugs.”

The September tracking poll continues to reflect the deep partisan divide in views on the ACA, which spill over to recognition of a significant drop in the level of the uninsured:

  • 47 percent have an unfavorable view of the ACA while 44 percent have a favorable one. 
  • 48% say the marketplace in their own state is working well, while 43 percent say it is not working well, but 49% say they are not working well nationally vs. 44% that say they are working well.
  • “When asked whether the uninsured rate is at an all-time low or all-time high, a quarter (26%) are aware that it is at an all-time low, while a fifth (21%) say that it is at an all-time high. Democrats and those with a favorable view of the health reform law are more likely to be aware of this; Republicans and those with an unfavorable view are less likely to be aware.”


With regard to the current level of the uninsured, HHS this week released a report indicating “the uninsured rate fell by around 40 percent for Americans in all income groups for 2010 through 2015, including individuals with incomes above 400 percent of the federal poverty level (FPL).”
Here’s the levels of reduction in the rate of uninsured they found during this time period by income levels and age:

  • Less than 100% FPL: 39% reduction
  • 100-125% FPL: 48% reduction
  • 125-250% FPL: 41% reduction
  • 250-400% FPL: 37% reduction
  • 400% FPL and higher: 42% reduction
  • 18-25 year olds: 52% reduction
  • 26-34 year olds: 36% reduction
  • 35-54 year olds: 39% reduction
  • 55-64 year olds: 40% reduction
Friday
Aug262016

EpiPens By The Numbers

by Clive Riddle, August 26, 2016

Without wading into the policy, prognostication, editorial or other narrative issues surrounding Mylan’s EpiPen pricing controversy, here simply is a collection of selected relevant data compiled related to all that is Mylan EpiPen:

Thursday
Aug042016

A Snapshot of Managed Care Pie

By Clive Riddle, August 4, 2016

MCOL’s Managed Care Fact Sheet webpages are being updated to reflect current data, so I took this opportunity to grab some Facts and provide this preview, baking this snapshot of managed care pie.

National HMO Enrollment is 92.4 million for 2016, up from 85.7 million in 2015, and a recent low of 66.8 million in 2007. The previous high was 81.3 million in 1999, just before managed care backlash whipped the numbers down. (1)

How does the managed care enrollment pie divide up?  33% are enrolled in HMOs, 57% in PPOs, 2% in POS plans and 7% in HDHPs.(1) - (3)  The top five national health plans by enrollment are United Health Group – 48.0 million; Anthem – 39.6 million; Aetna – 23.0 million; Cigna – 15.1 million and Health Care Service Corporation – 15.0 million. (14)

And what portion of the total national pie does managed care represent? 31% of Medicare beneficiaries are enrolled in Medicare Advantage plans, 63% of Medicaid enrollees are in Medicaid managed care plans, and 99% of commercial lives are enrolled in managed care. Factor in the 9% of the population that is still uninsured, and 70% of the total population is enrolled in some form of managed care plan. (4) – (10)

What are current resource use benchmarks in managed care – or how much of the pie is being eaten? HMO Hospital inpatient days per 1,000 members per year are 1,639 for Medicare, 395 for Medicaid and 231 for commercial; Commercial PPO are 237. HMO Physician visits per member per year are 10.2 for Medicare, and 4.8 for Medicaid and Commercial; Commercial PPO are 4.7. HMO Prescriptions per member per year are 29.9 for Medicare, 9.6 for Medicaid and 9.0 for Commercial; Commercial PPO are 11.8. (2) (11)

Getting back to pie, medical cost components – for a family covered by a PPO – are sliced up 31% for inpatient, 30% of physician, 19% for outpatient services, 17% for pharmacy and 4% for other services. (12)

So what does the pie cost? Single health plan premiums average $518 for HMOs and $548 for PPOs, and family premiums average $1,437 for HMOs and $1,539 for PPOs. Premium increases are estimated to be 4.3% in 2016, and have been under 5% after 2011, and under 8% after 2003. In 2002 – post managed care backlash -  they were 14.7%, but they were 8.1% or less in the pre managed care backlash era from 1993 to 2000, including a decrease of 1.1% in 1994.  Before that, double digit increases were the norm for a number of years.

(1) Total HMO Enrollment - Kaiser State Health Facts; Data Source: Health Leaders InterStudy, a Decision Resources Group Company July 2015 Data, accessed August 2016 www.statehealthfacts.org

(2) 2015 HMO-PPO Rx Digest Series, Sanofi www.managedcaredigest.com 

(3) New Census Survey Shows Continued Growth in HSA Enrollment, AHIP November 11, 2015  https://ahip.org/new-census-survey-shows-continued-growth-in-hsa-enrollment/     

(4) CMS Fast Facts: www.cms.gov/fastfacts/  

(5) Medicaid Enrollment Report as of January 2016: https://www.medicaid.gov/medicaid-chip-program-information/program-information/downloads/january-2016-enrollment-report.pdf 

(6) Kaiser Family Foundation State Health Facts Total Medicaid MCO Enrollment http://kff.org/other/state-indicator/total-medicaid-mco-enrollment/ 

(7) CDC Fast Facts, National Center for Health Statistics, Health, United States 2016: http://www.cdc.gov/nchs/ 

(8) Tricare Prime Beneficiaries 2016: www.tricare.mil/About/Facts/BeneNumbers.aspx 

(9) CDC May 2016: Health Insurance Coverage: Early Release of Estimates From the National Health Interview Survey, 2015 http://www.cdc.gov/nchs/data/nhis/earlyrelease/insur201605.pdf  

(10) Total U.S. Population data as of April 2016, U.S. Census Bureau: www.census.gov

(11) 2015 Public Payer Digest Series, Sanofi www.managedcaredigest.com

(12) Milliman Medical Index, Milliman, May 24, 2016 http://www.milliman.com/mmi/    

(13) Kaiser/HRET Survey of Employer-Sponsored Health Benefits, 2015. www.kff.org

(14) MCOL research from 2016 company reports

Friday
Jul152016

CMS Office of the Actuary on Health Expenditure Projections

By Clive Riddle, July 15, 2015

Where are US health care cost increases headed? The CMS Office of the Actuary tells us to expect 5.8 percent annual increases during 2015-2025, in their report: National Health Expenditure Projections 2015-2025.

The Office of the Actuary states “health spending is projected to grow 1.3 percentage points faster than Gross Domestic Product (GDP) per year over 2015-2025; as a result, the health share of GDP is expected to rise from 17.5 percent in 2014 to 20.1 percent by 2025. Federal, state and local governments are projected to finance 47 percent of national health spending (up from 45 percent in 2014).”

The report findings include:

  • National health spending growth is estimated to have been 5.5 percent in 2015.
  • By 2016, slower growth in health spending of 4.8 percent is projected as the enrollment in Medicaid and Marketplace plans slows and the associated declines in the number of the uninsured decreases.
  • Total annual health care spending growth is expected to average 5.8 percent over 2015-2025.
  • In 2015, medical price inflation slowed to 0.8 percent, down from 1.4 percent in 2014. Hospital prices increased by 0.9 percent while price growth in physician services fell by 1.1 percent.
  • The share of health expenses that Americans pay out-of-pocket is projected to decline from 10.9 percent in 2014 to 9.9 percent in 2025.
  • The insured share of the population is expected to continue to rise from 89 percent in 2014 to 92 percent by 2025.
  • Private health insurance expenditures are estimated to have increased by 5.1 percent from 2014 to 2015, reaching $1.0 trillion and will grow 5.4 percent thereafter to 2025.
  • Medicaid spending growth is slowing significantly in 2016, to 5.3 percent, which the report attributes to slower enrollment growth and stronger utilization management.
  • Medicaid spending growth is expected to average 5.6 percent for 2017-19, lower than in 2014-15.
  • In 2015, Medicare expenditures are expected to have been $647.3 billion, a 4.6-percent increase from 2014, driven partly by increased enrollment.
  • Medicare per-enrollee costs are estimated to have increased by only 2.4 percent, the same as the previous year, continuing the recent trend of low per-enrollee cost increases.
  • Prescription drug spending is projected to grow an average of 6.7 percent per year for 2016 through 2025. This follows growth of 12.2 percent in 2014 and 8.1 percent in 2015
Thursday
Jun022016

IMS Institute on the Global Oncology Market

By Clive Riddle, June 2, 2016

The IMS Institute for Healthcare Informatics this week released their new study: Global Oncology Trend Report: A Review of 2015 and Outlook to 2020, which examines the current and future global oncology market. Their 42-page report tells us that “more than 20 tumor types are being treated with one or more of the 70 new cancer treatments that have been launched in the past five years, with the sustained surge in innovative therapies driving the global oncology market to $107 billion in 2015. However, many of these drugs are not yet available to patients in most countries, and even when registered they may not be reimbursed under public insurance programs.”

The study finds that growth in global spending on oncology therapeutics and supportive care drugs increased 11.5 percent on a constant-dollar basis last year, with more than 500 companies actively pursuing oncology drug development around the world. Collectively, they are advancing nearly 600 new molecules through late-stage clinical development, most frequently for non-small cell lung cancer and breast, prostate, ovarian and colorectal cancers.

And as for the future, “annual global growth in the oncology drug market is expected to be 7.5 – 10.5 percent through 2020, reaching $150 billion. Wider utilization of new products—especially immunotherapies —will drive much of the growth, offset by reduced use of some existing treatments with inferior clinical outcomes. Payers also are expected to tighten their negotiation stance with manufacturers and adopt new payment models in an effort to drive greater value from their expenditures on these drugs.”

The report also shares that:

  • The pipeline of oncology drugs in clinical development has expanded by more than 60 percent during the past decade, with almost 90 percent of the focus on targeted agents.
  • The median time from patent filing to approval for oncology drugs in 2015 was 9.5 years, down from 10.3 years in 2013.
  • Of the 49 oncology New Active Substances analyzed that were initially launched between 2010 and 2014, fewer than half were available to patients by the end of 2015 in all but six countries: the U.S., Germany, UK, Italy, France and Canada.
  • Targeted immunotherapies are available in most developed countries, but none of the emerging markets outside of the European Union has yet registered these treatments.
  • Of the drugs approved in 2014 and 2015 by a set of developed countries analyzed, only the U.S., France and Scotland have more than half included on reimbursement lists at the end of 2015.
  • The annual growth rate in cancer drug costs has risen from 3.8 percent in 2011 to 11.5 percent in 2015, at constant exchange rates. Growth in the U.S. market increased from 2.0 percent to 13.9 percent in the same period.
  • The U.S. now accounts for about 45 percent of the global total market for therapeutics, up from 39 percent in 2011, due in part to the strengthening of the U.S. dollar and more rapid adoption of newer therapies.
  • In the U.S., cancer drugs now make up 11.5 percent of total drug costs, up from 10.5 percent in 2011
  • Net price growth in the U.S. on existing branded oncology drugs have averaged an estimated 4.8 percent in 2015, compared with 6.4 percent invoice price growth
  • In the U.S., cancer drugs dispensed through retail channels now account for more than one-third of total costs, up from 25 percent ten years ago and typically covered by pharmacy benefits. This reflects a shift in the mix of new therapies toward oral medicines, eliminating the need for injection or infusion in a physician’s office or outpatient facility.
  • Nearly 40 percent of the total costs of targeted therapies in the U.S. are now for oral formulations, up from 26 percent in 2010.
  • Only 17 percent of U.S. oncologists are in independent practices, unaffiliated with some type of integrated delivery network or corporate parent, down from 28 percent in 2010.
  • Average total treatment costs for patients in commercial insurance plans with a cancer diagnosis who are receiving active treatment reached $58,000 in 2014, up 19 percent from 2013.
  • Patients with commercial insurance who were treated in 2014 with cancer drugs received by injection or infusion were responsible for more than $7,000 of costs on average, compared to $3,000 for those patients receiving only oral medicines.
  • Some type of coupon or patient cost offset was used for more than a quarter of cancer drug retail prescriptions filled by patients with commercial insurance in 2015, up from 5 percent in 2011 and reflecting efforts by manufacturers to reduce patient out-of-pocket costs. The average cost offset has averaged about $750 per prescription over the past five years.
Friday
May272016

Practicing in an Age of Uncertainty

By Kim Bellard, May 27, 2016

If you've ever had a hard time trying to decide what's best for your health, perhaps you can take comfort in the fact that physicians often aren't so sure either. 

Or perhaps not.

new study in Annals of Surgery, and nicely reported on by Julia Belluz inVox, focused on surgical uncertainty.  The researchers sent four detailed clinical vignettes to a national sample of surgeons, seeking to get their assessment on the risks/benefits of operative and non-operative treatment, as well as their recommendations. You'd like to think there was good consensus on what to do, but that was not the case.

In one of the vignettes, involving a 68 year-old patient with a small bowel blockage, there was fairly universal agreement -- 85% -- that surgery was the best option.  In the other three vignettes, though, the surgeons were fairly evenly split about whether to operate or not, even on something as common as appendicitis. 

So, there may be a "right" answer but you might as well flip a coin in terms of getting it, or there may just not be a right answer.  Both options are troubling.

The authors believe that surgeons are less likely to want to operate as their perception of surgical risk increased and the benefits of non-operative treatment increased, and more likely to want to operate as their perception of surgical benefit increased and non-operative risk increased.  The problem is that surgeons vary dramatically -- literally from 0 to 100% -- on their perceptions of those risks.

Most surgeons based their estimates of risks/benefits on their experience, their training, and -- if you're lucky -- on whatever literature might be available, but it is doubtful that we can usually expect an objective, quantifiable assessment. 

The American College of Surgeons has developed a "surgical risk calculator" to help surgeons better gauge these risks, using data from a large dataset of patients.  However, an earlier related study from the same team of researchers found that it doesn't make much difference.  The calculator did narrow the variability of surgeons' assessment of risk, but: "Interestingly, it did not alter their reported likelihood of recommending an operation."

Oh, well.

It is not just surgeons who aren't always sure of the right course of action, of course.  A study in the American Journal of Managed Care found that 62% of physicians reported that they found the "uncertainty involved in providing patient care disconcerting."  The discomfort with uncertainty did not vary appreciably between type of specialty.

Then there is the example of PSA tests.  In 2008 the US Preventive Services Task Force recommended routine PSA tests not be given to men over 75, and in 2012 broadened that recommendation to all ages.  Yet data suggest that the group least likely to need the tests -- men over 75 -- had the smallest declines in rates of testing.  Almost 40% of this age group are still getting the test, which is not far from the previous rates. 

As one researcher told The New York Times,   "That’s just insanity...bad medicine, poor use of health care resources and poor decision-making.”

There's all too much of that in our health care system.

This post is an abridged version of the posting in Kim Bellard’s blogsite. Click here to read the full posting

Thursday
May192016

Patients Happy With PCPs But Not Always Following Their Advice Due to Costs

By Clive Riddle, May 19, 2016

The Physicians Foundation has just released a 74-page report with results from their Physicians Foundation Patient Survey conducted by Harris Poll. The report findings state that “95 percent of patients surveyed are satisfied or very satisfied with their PCP’s ability to explain information in a manner they understand, while 96 percent feel their physicians are respectful of them. Moreover, 93 percent were satisfied or very satisfied with how well their PCP listened to them during their most recent exam, with 92 percent noting high levels of satisfaction relative to how well their doctor knew their medical history.”

But the report notes that “patients who saw a primary care physician for their most recent routine exam are not fully adhering to treatment plans, avoiding routine check-ups or opting not to take prescription medication due to rising healthcare costs.”

They cite that “ sixty-two percent of U.S. adults are concerned with being able to pay for medical treatment if they get sick or injured. Almost half (48 percent) are not confident they could afford care should they become seriously ill. In addition, more than a quarter of U.S. adults (28 percent) have skipped a medical test, treatment or follow-up or avoided a visit to the doctor for a medical problem in the past 12 months because of costs. Twenty-seven percent of patients have avoided filling a prescription in the past 12 months, noting costs as a primary factor.”

Who do patients feel are driving these costs? The report says that “59 percent of patients surveyed say it’s the cost of prescription drugs. One-third (33 percent) of patients cited fraud as another contributor factor, followed by social conditions and poverty (28 percent), government mandates (26 percent) and an aging population (25 percent).”

Rip Hollister, MD, a Physicians Foundation board member tells us “patients recognize that there is an array of stakeholders and external influences that affect treatment options and, in effect, clinical autonomy. Historically, treatment plans have been developed between the doctor and patient. Yet, patients understand that there are now many other parties ‘in the room,’ so to speak, which complicates and challenges the manner in which physicians practice medicine.”

In this regard, the report cites how much patients felt each of the following stakeholder groups, as a whole, impacts treatment options available to them:

  • Health insurance companies (83 percent)
  • Physicians (79 percent)
  • Pharmaceutical companies (68 percent)
  • Federal legislature (60 percent)
  • State legislatures (54 percent)
Friday
Mar252016

Medication Adherence and Out of Pocket Costs

By Clive Riddle, March 25, 2016

While out of pocket costs impact consumer demand and utilization for healthcare services in various degrees for all aspects of care, the relationship is perhaps the most direct for prescriptions. This direct relationship is due to both the relatively lower average cost per prescription compared to the per unit cost of most other health care services, along with the behavioral economics implications that a prescription typically delivers delayed results, while most other healthcare services provide perceived potentially immediate results.

In this context, Truveris, a pharmacy benefits solutions provider, has just released study results examining medication adherence based upon out of pocket prescription costs. They found that “85 percent of prescriptions are filled when the price at the register is around $30. Once the cost of a prescription surpasses $50, the rate starts a notable decline, dropping to 76 percent. The number of prescriptions filled drops even further, to 65 percent, when the cost is $90 and above.”

Kristin Begley, Chief Pharmacy Officer at Truveris tells us “as healthcare costs continue to burden Americans, there is ample evidence of increased prescription costs leading to discontinuation of medications in order to save money. We’re seeing a troubling trend that when drug prices reach a certain level, consumers are simply walking away, not filling the prescriptions and, in effect, gambling on their health. This should be an urgent wake-up call across the healthcare spectrum.”

Taking things a step further, a Geisinger study published in the February 2016 issue of The American Journal of Managed Care “shows that instituting a zero prescription co-pay for its chronically ill employee population resulted in a positive cost saving and return on investment.”

The Geisinger study found “that a zero co-pay drug program for its chronically ill employee population was associated with positive cost savings and a return on investment of 1.8 over five years….More than 200 prescription medications were selected to be eligible for the $0 co-pay program; those selected were designated for chronic conditions like high blood pressure, cholesterol and diabetes management and were preventative in nature. Geisinger researchers say that VBID implementation within the context of a wider employee wellness program targeting the appropriate population can potentially lead to further positive cost savings.”

Friday
Mar182016

Under the Influence

By Kim Bellard, March 18, 2016

new analysis by ProPublica found that doctors who receive money from drug companies do, in fact, tend to prescribe more brand name drugs, and that the more money they got, the more brand name prescribing they did.

ProPublica looked at prescribing patterns from five specialties -- cardiovascular, family medicine, internal medicine, ophthalmology, and psychiatry -- with the restriction that individual physicians had to have had at least 1,000 Part D prescriptions in the study period (2014).  Overall, about three-fourths of physicians took some money from a drug company, although there was wide variation by specialty and geography -- e.g., nearly 9 of 10 cardiologists took payments, just as around 90% of physicians took such payments in Nevada, Kentucky, Alabama, and South Carolina. 

Conversely, in Minnesota and Vermont the percentage was closer to 25%.

The amount of the payments appeared to have an impact.  Internists who received no payments had brand-name prescribing rates of about 20%, while those getting more than $5,000 had rates of around 30%.

The defenses from physician organizations and the drug industry make for fun reading.  Dr. Richard Baron, the president and chief executive of the America Board of Internal Medicine, protested that doctors almost have to go out of their way to avoid taking these kinds of payments.

The president of the American College of Cardiology suggested the patterns were re-enforcing; the more they learn about a drug, the more they tend to use it, and the more they use it, the more drug companies pay them to be speakers and consultants.

Seriously, these are their defenses?

We've been learning a lot more about how pervasive industry payments -- not just pharmaceutical companies but also medical device and other health care suppliers -- are since the advent of the Open Payments initiative.  We're talking about over $6.5b in payments in 2014, made to over 600,000 physicians and 1100 hospitals.  I wrote about this last summer, and the new ProPublica analysis certainly should rattle any remaining doubts anyone might have had about the potential impact of such payments. 

True to form, last fall the AMA called for a ban on DTC advertising.   That's right, they don't seem disturbed about the $6.5b physicians are getting, but they think that the ads that we see are bad.  There's a certain logic to that; it has long been suspected that these ads help drive consumer demand.

Austin Frakt, of The New York Timesrecently challenged this conventional wisdom.  For one thing, he notes that while drug ads do cause an increase in sales for the advertised drug, they also increase sales of other drugs in the same class, using Prozac as an example.  Seeing drug ads may help "normalize" the condition being treated, making getting treatment for it more acceptable, and may also help encourage patients to continue with existing prescriptions.  

Mr. Frakt points out that it is not only the drug companies who benefit from drug advertising, but also physicians.  Every $28 in drug advertising results in an additional doctor visit; someone has to do the prescribing, after all.  And, of course, the DTC spending is dwarfed by the direct-to-physician "promotions" -- Mr. Frakt estimates drug companies spend seven times more on these than on DTC advertising. 

So we're back to the ProPublica analysis. 

It simply is not plausible to maintain that these efforts are not influencing physicians' decisions, and that they may not always be in the best interests of patients.  As Bloomberg put it last summer: the payments "seek to convince doctors that second choice is OK."
 
Well, I don't know about you, but that is not OK with me. 

This post is an abridged version of the posting in Kim Bellard’s blogsite. Click here to read the full posting

Thursday
Mar102016

Retail Clinics: Trying to Reconcile Cost Per Visit, Utilization, Access and Convenience

By Clive Riddle, March 10, 2016

The March issue of Health Affairs features a paper presenting study findings on retail clinic:  Retail Clinic Visits For Low-Acuity Conditions Increase Utilization And Spending. The title would seem to say it all regarding their findings. The study involved retail clinic use by 3 million Aetna members, from 2010 to 2012 for 11 low-acuity conditions. 

Here’s what the authors had to say in part in their abstract: “We found that 58 percent of retail clinic visits for low-acuity conditions represented new utilization and that retail clinic use was associated with a modest increase in spending, of $14 per person per year. These findings do not support the idea that retail clinics decrease health care spending.”

Kaiser Health News, in covering the story, notes that “The study doesn’t contradict earlier research that found retail clinics provide care that costs 30 to 40 percent less than similar care provided at a physician’s office and that the treatment for routine illnesses was of similar quality. But it suggests those savings are more than offset by increased use of medical services.”

But for some who embrace this perspective, but also are critics of increased consumer cost-sharing including high deductible plans that can limit access, is this perhaps a bit contradictory from a policy standpoint? If you are concerned the increased access and use of such services drives up costs, should you be concerned about cost savings measures that decrease potential access and use?

Interestingly, a Policy Brief in last month’s Health Affairs  on High Deductible Health Plans features the lead-in: “As high-deductible health plans become increasingly prevalent in both group and individual markets, it remains to be seen how they will affect health care access and outcomes.”

Is it a paradox that high-deductible health plan consumers are target audiences for retail care clinics?

Last month, NPR, Robert Wood Johnson Foundation and Harvard T.H. Chan School of Public Health released the 42-page study: Patients’ Perspectives on Health Care in the United States which addressed retail clinic and urgent care use among many things. 92% of survey respondents rated retail clinic costs as reasonable, and 74% rated urgent care costs as reasonable, compared to 77% rating their personal doctor visit costs as reasonable and 58% rating emergency room costs as reasonable.

Granted, the study published in Health Affairs didn’t dispute the lower cost per visit – they just conclude that the retail supply creates demand and thus drives up costs. But what about access, and what happens to overall costs when access isn’t adequate? Isn’t that the critique of high deductible plans – that high out of pocket costs become a barrier to access?

The argument put forth in Health Affairs is your out of pocket costs might be higher per visit, but ultimately lower overall, by always sticking with your personal doctor because you will see them less.

And see them less you very well may. Another aspect of access addressed in the NPR study: 22% said they could not see their regular doctor at some point in the past two years when they needed health care, with the number one reason the doctor did not have any available appointment times (followed by care was needed at night or on the weekend.)

Friday
Mar042016

Truven Examines Scope and Drivers in Bundled Commercial Spend for Lower Joint Replacement 

By Clive Riddle, March 4, 2016

Truven Health Analytics has just released a twelve page research brief:  Bundled Pricing for Total Joint Replacements in the Commercially Insured Population: Cost Variation Insights by Bundled Care Components, which follows up on their recently released eight page brief on this same topic: Geographic Variation and Cost-Driver Insights.

Truven “found that the primary drivers of cost variation for major lower joint replacement are tied to hospital cost and length of stay. For facility costs, the study attributes up to $1,944 per additional day in total cost variation. That variation is independent of professional costs. The study builds on previous research that found more than $10,000 in commercial bundled spend variation for the same surgeries based on geography.”

Truven shares these key findings:

  • The increase in facility cost only (removing professional cost) for each additional day a patient is hospitalized after the procedure varies from $313 per day in the East North Central region to $1,944 per day in the Pacific region, a difference of more than $1,600.
  • On average, the cost to treat a patient at a rehab facility was $10,600 per patient, versus $5,300 per patient at a skilled nursing facility, and $1,300 using home health services. And, the cost for rehab facilities varied widely by region, with the cost per patient in the Pacific totaling close to $22,500 compared with roughly $7,000 per patient in New England.
  • The cost per bundle for readmissions varied from $538 in the East South Central to $918 in the West South Central division. This lower cost in the East South Central resulted from both a low rate of readmission (3.3 percent) and a low cost per discharge ($16,340).

In their most recent brief, Truven notes that “in our previous research, we estimated the marginal impact of one extra day in the hospital after a TJR to be about $880 per day across all geographic divisions.  To further analyze that finding, we used a mixed effects regression model, with fixed average professional costs, to quantify the increase in facility cost only for each additional day a patient remains hospitalized after the procedure…. The average impact varied from $313 or 1 percent of the base price per additional day in the anchor facility after initial day of hospitalization in the East North Central division, to $1,944 or 6.2 percent of the base price in the Pacific. That’s a difference of more than $1,600.”

Bob Kelley, senior research fellow, advanced analytics, at Truven Health Analytics tells us “as providers and payers begin to consider bundled payment programs for these procedures, it is increasingly important to understand the cost implications of each additional inpatient day, as well as post-acute care and readmissions. Once claims-based, actual patterns are recognized and understood, guidelines and standard best practices can be put in place to guide discharge planning and post-acute care based on patient risk for readmission and other factors contributing to a successful recovery.”

Friday
Nov202015

The Prescription Drug Locomotive and the U.S Big Slice of the Global Rx Pie

by Clive Riddle, November 20, 2015

With prescription drug spending now having taken over the locomotive of the healthcare cost train, it behooves stakeholders to better get to know what lies on the tracks ahead. The IMS Institute for Healthcare Informatics has just released the 47-page report: Global Medicines Use in 2020:  Outlook and Implications in which they examine the global use of medicines and spending levels in 2020, including small and large molecules, brands and generics, those dispensed in retail pharmaceutics as well as those used in hospital or clinic settings.

IMS tells us the report “found that total global spend for pharmaceuticals will increase by $349 billion on a constant-dollar basis, compared with $182 billion during the past five years. Spending is measured at the ex-manufacturer level before adjusting for rebates, discounts, taxes and other adjustments that affect net sales received by manufacturers. The impact of these factors is estimated to reduce growth by $90 billion, or approximately 25 percent of the growth forecast through 2020.”

The report also tells as that “developed markets will contribute 63% of the spending, led by the U.S.  Original brands will represent 52% of spending and 85% of global spending will be for medicines to treat non-communicable diseases.” 

A pie chart exhibit in the report is telling in how large the U.S. slice of the medicine spending pie is projected for 2020 – 41% of global spending, with the next closest slice being the entire European Union at 13%.

Report findings on spending impacting U.S. costs include:

  • Brand spending in developed markets will rise by $298 billion as new products are launched and as price increases are applied in the U.S., most of which will be offset by off-invoice discounts and rebates. 
  • Patent expiries are expected to result in $178 billion in reduced spending on branded products, including $41 billion in savings on biologics as biosimilars become more widely adopted. 
  • Many of the newest treatments are specialty medicines used to address chronic, rare or genetic diseases and yielding significant clinical value. By 2020, global spending on these medicines is expected to reach 28 percent of the total.
  • More than 90 percent of U.S. medicines will be dispensed as generics by 2020. Generic medicines will continue to provide the vast majority of the prescription drug usage in the U.S., rising from 88 percent to 91-92 percent of all prescriptions dispensed by 2020. 
  • Spending on medicines in the U.S. will reach $560-590 billion, a 34 percent increase in spending over 2015 on an invoice price basis. 
  • While invoice price growth – which does not reflect discounts and rebates received by payers – is expected to continue at historic levels during the next five years, net price trends for protected brands will remain constrained by payers and competition, resulting in 5-7 percent annual price increases. 

Some international findings include:

  • Global medicine use in 2020 will reach 4.5 trillion doses, up 24 percent from 2015.
  • Most of the global increase in use of medicines over the next five years will take place in pharmerging markets, with India, China, Brazil and Indonesia representing nearly half of that growth.
  • Generics, non-original branded and over the counter (OTC) products will account for 88 percent of total medicine use in pharmerging markets by 2020, and provide the greatest contribution to increased access to medicines in those countries. 
  • Newer specialty medicines, which typically have low adoption rates in pharmerging countries lacking the necessary healthcare infrastructure, will represent less than one percent of the total volume in those markets.
  • Global spending will grow by 29-32 percent through 2020, compared with an increase of 35 percent in the prior five years. 
  • Spending levels will be driven by branded drugs primarily in developed markets, along with the greater use of generics in pharmerging markets—offset by the impact of patent expiries. 
Friday
Oct302015

A Definitive Study and Reference Resource on Healthcare Cost and Utilization

By Clive Riddle, October 30, 2015

The Health Care Cost Institute (HCCI) has just released its free 26-page 2014 Health Care Cost and Utilization Report, and 92-page Appendix, which provide a definitive examination of detailed U.S. health care cost and utilization component line items and demographics. Their study – as with other major cost studies released this year – put a lot of focus on increases in prescription drug prices.

They found the costs increased 3.4 percent in 2014, with overall utilization decreasing somewhat, while prices for all categories of services rose.  Average spending per person was $4,967, up $163, including out-of-pocket spending of $810 that grew 2.2%.

With prescription costs standing out, they note that “despite a nearly 16 percent decrease in use of brand prescriptions, spending on these prescriptions jumped by $45 per capita in 2014—an increase four times larger than in 2013. Much of this increase was due to use of high-priced Hepatitis C drugs Olysio, Sovaldi, and Harvoni, which became available starting in late 2013.”

Here’s some other key findings:

  • “In 2014, the largest decline in use (-2.7%) was for acute admissions, which fell by 1 admission per 1,000 individuals. The smallest decline in use (-0.9%) was for outpatient visits, which fell by 3 visits per 1,000 individuals.”
  • “The smallest average price increase was for professional services (3.1%), an increase of $3 per service. The largest average price increase was for acute inpatient admissions (4.6%), an increase of $831 per admission.”
  • “Spending out of pocket on acute inpatient admissions (–$1) and on brand (–$9) and generic (–$4) prescriptions decreased by $14 per capita in 2014 compared to the previous year, while spending out of pocket on outpatient ($16) and professional ($15) services increased by a total of $31 per capita in 2014.”
  • “Every year between 2010 and 2014, out-of-pocket spending was higher by women than by men. This difference grew every year, reaching $237 in 2014.”
  • “The difference in spending between the oldest and youngest age groups studied increased every year studied: from $6,281 in 2010 to $6,806 in 2014. In 2014, spending was $2,660 for children ages 0-18 and $9,466 for pre-Medicare adults, ages 55-64.”
Thursday
Oct222015

I'm Shocked, Shocked

By Kim Bellard, October 22, 2015

Some new research on the effect of physician practice arrangement has on spending offer some disappointing -- but not entirely surprising -- results.

Take physician groups. The death of the independent physician practice, working solo or in a small practice, has long been predicted. Honestly: would you rather be treated by a doctor practicing alone, or by one at the Mayo Clinic? Physician groups allow for things like development of best practices, administrative efficiencies, and, in this era of Big Data, larger data sets that can be used to improve patient care. When it comes to physician groups, bigger would seem to be better.

If physician groups are good, the theory goes, then integrating them clinically and financially with hospitals, such as through partnerships or common ownership, should even better.

The AMA says solo practice physicians now are only 17% of all physicians, down from 40% in 1983, and that physician ownership of their practice has declined from 76% in 1983 to just over 50% now. Our health care system, it would seem, is destined to be made up of large physician groups, many of which will be owned by hospitals.

Too bad both larger groups and hospital ownership apparently end up costing us more.

A new study in Health Affairs found that as physicians concentrate in larger groups, prices tend to go up, at least for the 15 high volume, high cost procedures the authors looked at. It might seem that whatever savings might be gained by becoming part of a group are not being passed on to consumers (or their health plans), and/or larger size allows groups to bargain for better reimbursement rates from payors.

An earlier survey, by one of the lead authors of the new study, found that more competition among physicians did, in fact, result in lower prices, at least for office visits. The moral appears to be, if you don't want to compete with them, join them!

Then there is the hospital ownership effect. A study in JAMA Internal Medicine found that increased hospital/physician financial integration led to greater spending, primarily in outpatient care and almost entirely due to higher prices, not higher utilization. The AHA protests that the study "is not reflective of the changes happening in today’s health-care market," citing newer value-based payment arrangements and hospital price increases that are at historically low levels.

Maybe the AHA is right. Maybe once we move more fully into the wonderland of value-based payment arrangements everything will work out: better quality for same or lower costs.

I've lived through DRGs, RBRVS, capitation, global capitation, staff model HMOs, IPAs, and an array of cost/quality incentive programs -- each of which was supposed to be the next magic bullet -- so I'm not holding my breath that payors will finally be able to outsmart providers when it comes to controlling revenue.

Don't get me wrong: I've long been a believer both in large physician groups and in clinical integration. But I worry that those strategies to improve health care delivery are now being used more as tactics to maintain and even improve revenue.

As I've written before, when you have to create a new model that is supposed to be patient-centered, and providers demand to get paid more just for participating it in, it's a pretty clear indication that our health care system isn't about patients but rather is about the providers.

The problem isn't the structures themselves but rather their focus.

This post is an abridged version of the posting in Kim Bellard’s blogsite. Click here to read the full posting

Friday
Sep112015

Public Exchange Subsidies – A Snapshot with Distant Clouds

By Clive Riddle, September 11, 2015

Two item of note occurred this week with respect to public exchange subsidies and enrollment: CMS released their June 30, 2015 Effectuated Enrollment Snapshot, and federal judge Rosemary Collyer in an unprecendented ruling that congress has standing for litigation, has allowed United States House of Representatives v. Burwell et al, U.S. District Court for the District of Columbia, No 14-1967 to move forward. 

So the attempts to chip away at health insurance marketplace subsidies did not die with the Supreme Court ruling on King v. Burwell, and another cloud, albeit distant for now – as it will undoubtedly wind through an appeals process assuming it succeeds at Collyer’s level – hangs over the head of public exchange subsidies. 

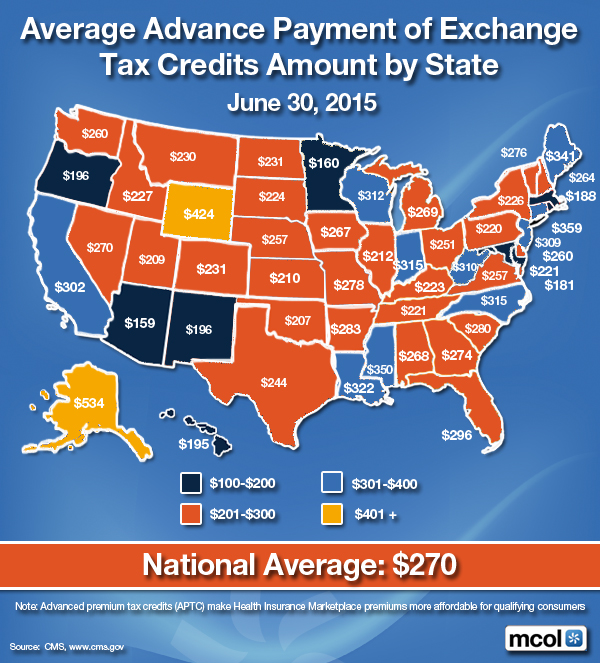
But in the meantime, CMS has provided a current picture of what these subsidies entail. CMS announced  that “Of the approximately 9.9 million consumers nationwide with effectuated Marketplace enrollments at the end of June 2015, about 84 percent, or more than 8.3 million consumers, were receiving an advanced premium tax credit (APTC) to make their premiums more affordable throughout the year. The average APTC for those enrollees who qualified for the financial assistance was $270 per month. There were 7.2 million consumers with effectuated enrollments at the end of June 2015 through the 37 Federally-Facilitated Marketplaces (including State Partnership Marketplaces) and supported State-based Marketplaces (collectively known as HealthCare.gov states) and 2.7 million through the remaining State-based Marketplaces.”

Here is an infographoid MCOL will release next week, mapping the average subsidies by state:

CMS notes that “the ten states with the highest rate of consumers who received financial assistance through APTC were: Mississippi (95.4%), Wyoming (92.2%), North Carolina (91.6%), Florida (91.3%), Alabama (90.9%), Louisiana (90.7%), Georgia (90.0%), Arkansas (90.0%), Wisconsin (89.6%), and Alaska (88.8%). The states with the lowest rate of consumers who received APTC are: District of Columbia (10.2%), Minnesota (54.8%), Colorado (55.3%), Hawaii (61.4%), New Hampshire (62.8%), Vermont (64.2%), Utah (65.6%), Kentucky (69.8%), Maryland (70.7%), and New York (71.4%).”

With respect to enrollment by metal plan, CMS shared that 1% were enrolled in Catastrophic plans (63,174); 21% in Bronze plans (2,096,542), 68% in Silver plans (6,761,363); 7% in Gold plans (695,377); and 3% (332,624) in Platinum plans.

The issue of inappropriate marketplace enrollment has been increasingly raised by various parties. CMS released data regarding enrollment data matching initiatives, noting “During the time period from April 1, 2015 to June 30, 2015, enrollment in coverage through the Federally-facilitated Marketplaces was terminated for about 306,000 consumers with citizenship or immigration status data matching issues who failed to produce sufficient documentation of their citizenship or immigration status. In addition, during the same time period, about 734,000 households with annual household income inconsistencies had their APTC and/or CSRs for 2015 coverage adjusted. Overall, as of June 30, 2015 the Marketplace has ended 2015 coverage for approximately 423,000 consumers with 2015 coverage who failed to produce sufficient documentation on their citizenship or immigration status and has adjusted APTC and/or CSRs for about 967,000 households.”

Wednesday
Jun102015

PwC and Milliman Examination of Medical Cost Trends

by Clive Riddle, June 10, 2015

PwC projects a medical cost trend for 2016 of 6.5%, netting down to 4.5% after benefit design changes. Milliman tells us that the 2015 actual trend was 6.3%, up from 5.4% in 2014.

PwC’s Health Research Institute this week released their tenth annual Behind the Numbers report, which includes a “projection for the coming year’s medical cost trend based on analysis of medical costs in the large employer insurance market. In compiling data for 2016, HRI interviewed industry executives, health policy experts and health plan actuaries whose companies cover more than 100 million employer based members.

Milliman released their fifteenth annual Milliman Medical Index report two weeks ago, which is “an actuarial analysis of the projected total cost of healthcare for a hypothetical family of four covered by an employer-sponsored preferred provider organization (PPO) plan. Unlike many other healthcare cost reports, the MMI measures the total cost of healthcare benefits, not just the employer’s share of the costs, and not just premiums. The MMI only includes healthcare costs. It does not include health plan administrative expenses or profit loads.”

With respect to 2015, Milliman found “the cost of healthcare for a typical American family of four covered by an average employer-sponsored preferred provider organization (PPO) plan is $24,671”, up from $23,215 in 2014. The 2015 family costs works out to $2,055 on a monthly basis.

Milliman emphasizes the importance of the role the Rx costs play in the mix. They note “prescription drug costs spiked significantly, growing by 13.6% from 2014 to 2015. Growth over the previous five years averaged 6.8%. The 2015 spike resulted from the introduction of new specialty drugs as well as price increases in both brand and generic name drugs, increases in use of compound medicines, and other causes. Since the MMI’s inception in 2001, prescription drugs have increased by 9.4% on average, exceeding the 7.7% average trend for all other services. Prescription drug costs now comprise 15.9% of total healthcare spending for our family of four, up from 13.2% in 2001.”

Milliman also highlights the role of cost-sharing, citing that the “total employee cost (payroll deductions plus out-of-pocket expenses) increased by approximately 43% from 2010 to 2015, while employer costs increased by 32%. Of the $24,671 in total healthcare costs for this typical family, $10,473 is paid by the family, $6,408 through payroll deductions, and $4,065 in out-of-pocket expenses incurred at point of care.”

PwC also keys on these two issues for 2016 as well, with drugs as an inflator, and cost-sharing as a deflator of the medical trend.  PwC spotlighted two inflators of the 2016 medical trend: (1) New specialty drugs entering the market in 2015 and 2016 will continue to push health spending growth upward; and (2) Major cyber-security breaches are forcing health companies to step up investments to guard personal health data, adding to the overall cost of delivering care.

PwC notes three factors that serve to "deflate" the 2016 medical cost trend: (1) The Affordable Care Act’s looming “Cadillac tax” on high-priced plans which is accelerating cost-shifting from employers to employees to reduce costs; (2) Greater adoption of “virtual care” technology that can be more efficient and convenient than traditional medical care; and (3) New health advisers helping to steer consumers to more efficient healthcare.

PwC also comments on the longer range medical trend perspective, citing four key cost growth factors H observed over the past decade:

  • The healthcare-spending trajectory has leveled off but is not declining;
  • Cost sharing slows consumer use of health services;
  • Curtailing inpatient care lowers costs; and
  • The ACA has had minimal direct effect on employer health costs.
Thursday
May212015

Not One Penny More

By Kim Bellard, May 21, 2015

If you've been to a doctor's office or seen some other health care provider, chances are you've had to sign a patient consent form that, among other things, makes you promise that whatever they end up doing to you, and however much they choose to charge you for it, you're responsible for paying.  If your health plan happens to get you a negotiated rate and perhaps covers some of the expenses, that's great, but the provider is still looking to you for payment.

Maybe you shouldn't be so quick to sign.

I don't know which is worse: that providers don't think they should tell you in advance what they plan to do to you, or that they don't want to admit how much they will try to charge for it.  Honestly, why do we keep falling for this?

I thought about this when reading Kaiser Health News' Radical Approach to Huge Hospital Bills: Set Your Own Price.  It profiles benefits consulting company ELAP Services, which goes beyond traditional services like benefits design, direct contracting, and medical bill reviews by also vowing to go to court if necessary to support their customers in disputes over medical bills.

The KHN article cited the example where an employee of one of ELAP's clients had back surgery and was billed $600,000 by the hospital.  ELAP analyzed the hospital's Medicare's cost reports, and advised the client to pay a much lower amount.  "We wrote a check to the hospital for $28,900 and we never heard from them again," said the client's CFO.

ELAP CEO Steve Kelly says "overwhelmingly, the providers just accept the payment."  ELAP has clients write their process for determining reimbursements into benefit plan documents to give greater legal weight.  They already have a federal court ruling in support of their process.  The contract requires them to defend patients from any collections efforts, in return for a percentage of the savings.

Most health plans base their out-of-network payments on "reasonable charges," which is how most health insurance plans worked prior to the advent of network plans like PPOs, when negotiated payment rates became the norm.  

Whether it has worked as intended is not entirely clear, but what is clear is that providers can come after patients for amounts not paid out-of-network by the health plans, all the way up to billed charges, not just to the "reasonable charges."

What I want to know is, if health plans truly believe their limits on charges are reasonable, why don't more of them act like ELAP when providers' charges exceed them?   ELAP makes it clear whose side they are on; health plans, not so much.

I view the charge structure of most providers as a pernicious symptom of much of what is wrong with our health care system.  They rarely have much to do with either actual costs or market forces, and they reflect an arrogant attitude that consumers are there to be gouged as much as possible.  Or, more charitably, if not arrogance, then a certain benign neglect to patients' financial well-being.  

I'd love to see a health plan whose EOBs not only detailed how much they were paying and how much of the remaining balance the consumer had to pay, but also said, "by the way, we think $X is the most your provider should charge you for this service, and we don't think you should pay a penny more.  If they try to charge you more, let us know and we'll help you fight it."

Now that would be a health plan that consumers would think more of, one that is truly on their side.

This post is an abridged version of the posting in Kim Bellard’s blogsite. Click here to read the full posting

Thursday
May072015

Annual Global Oncology Medicine Spending Tops $100 Billion

by Clive Riddle, May 7, 2015 

The IMS Institute for Healthcare Informatics has just released a new report:  Developments in Cancer Treatments, Market Dynamics, Patient Access and Value: Global Oncology Trend Report 2015 which tells us “total global spending on oncology medicines – including therapeutic treatments and supportive care – reached the $100 billion threshold in 2014, even as the share of total medicine spending of oncologics increased only modestly.” 

The report found that “growth in global spending on cancer drugs – measured using ex-manufacturer prices and not reflecting off-invoice discounts, rebates or patient access programs – increased at a compound annual growth rate (CAGR) of 6.5 percent on a constant-dollar basis during the past five years. Oncology spending remains concentrated among the U.S. and five largest European countries, which together account for 66 percent of the total market, while the rising prevalence of cancer and greater patient access to treatments in pharmerging nations continues to grow and now accounts for 13 percent of the market” 

Murray Aitken, IMS Health senior vice president and executive director of the IMS Institute for Healthcare Informatics tells us“the increased prevalence of most cancers, earlier treatment initiation, new medicines and improved outcomes are all contributing to the greater demand for oncology therapeutics around the world. Innovative therapeutic classes, combination therapies and the use of biomarkers will change the landscape over the next several years, holding out the promise of substantial improvements in survival with lower toxicity for cancer patients.” 

Findings shared in the report include: 

  • Growth in the U.S. has risen more slowly at 5.3 percent CAGR, reaching $42.4 billion in 2014, representing 11.3 percent of total drug spending compared to 10.7 percent in 2010.
  • in the EU5 countries oncology now represents 14.7 percent of total drug spending, up from 13.3 percent in 2010.
  • Targeted therapies now account for nearly 50 percent of total spending and have been growing at 14.6 percent CAGR since 2009.
  • Within the U.S., two-thirds of Americans diagnosed with cancer now live at least five years, compared to just over half in 1990.
  • The availability of new oncology medicines varies widely across the major developed countries, with patients in Japan, Spain and South Korea having access in 2014 to fewer than half of the new cancer drugs launched globally in the prior five years.
  • Average therapy treatment costs per month have increased 39 percent in the U.S. over the past ten years in inflation-adjusted terms. Over the same period, patient response rates have improved by 42 percent and treatment duration has increased 45 percent, reflecting improved survival rates.
  • Within the U.S., patient out-of-pocket costs have risen sharply for intravenous cancer drugs, increasing 71 percent from 2012 to 2013, reflecting changes in plan designs and increased outpatient facility costs. 

An interactive version of the full report is available via iTunes, but requires am iPad for viewing. Pdf versions of exhibits can be downloaded here