The State of Telehealth as We Slide into 2022
By Clive Riddle, December 10, 2021
A HHS 34-page study released this week by ASPE (Office of the Secretary for Planning and Evaluation) entitled Medicare Beneficiaries’ Use of Telehealth in 2020: Trends by Beneficiary Characteristics and Location says the bottom line on telehealth in the first year of the pandemic was “Medicare telehealth flexibilities mitigated declines in in-person visits during the pandemic in 2020, but there is also evidence of disparities by race/ethnicity and for rural populations.”
The ASPE report found that “the share of Medicare visits conducted through telehealth in 2020 increased 63-fold, from approximately 840,000 in 2019 to 52.7 million. States with the highest use of telehealth in 2020 included Massachusetts, Vermont, Rhode Island, New Hampshire and Connecticut. States with the lowest use of telehealth in 2020 included Tennessee, Nebraska, Kansas, North Dakota and Wyoming.”
Other key findings included:
- Despite the increase in telehealth visits during the pandemic, total utilization of all Medicare FFS Part B clinician visits declined about 11% in 2020 compared to levels in 2019.
- Most beneficiaries (92%) received telehealth visits from their homes, which was not permissible in Medicare prior to the pandemic.
- Prior to the pandemic, telehealth made up less than 1% of visits across all visit specialties but increased substantially in 2020. Telehealth increased to 8% of primary care visits, while specialty care had smallest shift towards telehealth (3% of specialist visits).
- Visits to behavioral health specialists showed the largest increase in telehealth in 2020. Telehealth comprised a third of total visits to behavioral health specialists.
- While data limitations preclude clear identification of audio-only telehealth services, up to 70% of these telehealth visits during 2020 were potentially reimbursable for audio-only services.
- Black and rural beneficiaries had lower use of telehealth compared with White and urban beneficiaries, respectively. Telehealth use varied by state, with higher use in the Northeast and West, and lower in the Midwest and South.
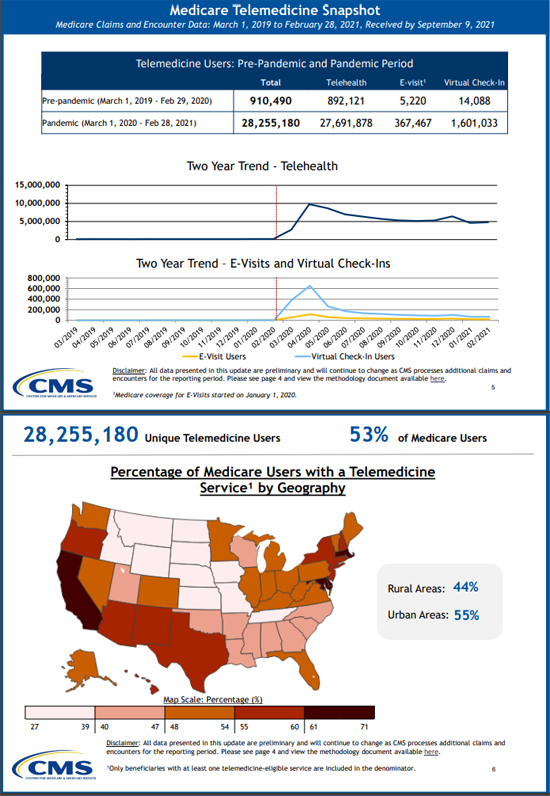
At the same time, CMS released a Medicare Telemedicine Data Snapshot Overview, highlighting claims data between March 1, 2020 and February 28, 2021. In the CMS telemedicine world, they provide these definitions of services that they summarize in their snapshots:
- Telehealth Visits: Routine office visits provided via video (requires synchronous, real-time audio and/or video communication) with new or established patients. In this snapshot, we group audio-only telehealth in this service category.
- Virtual Check-ins: Short patient-initiated communications with a healthcare practitioner via telephone or other telecommunications device to decide whether an office visit or other service is needed.
- E-visits: Non-face-to-face patient-initiated communications with a healthcare practitioner through an online patient portal.
Here’s a peek at two of the seven sections they provide in the overview; they also provide a link to the entire data snapshot file:
Last week, RAND released a new study published in JAMA: Assessment of Patient Preferences for Telehealth in Post–COVID-19 Pandemic Health Care, which ‘found that people who preferred video visits were more sensitive to out-of-pocket costs than those who preferred in-person visits, as a $20 increase in cost was associated with more people switching from video visits to in-person care.”
RAND reports that “when faced with a choice between an in-person visit or a video visit for a nonemergency health issue, survey participants generally preferred in-person care. Those who were younger, had higher incomes, and had more education were more likely to opt for video visits. Experience with telehealth was associated with a preference for future video visits. Just 2% of those who previously had a video visit were unwilling to do so again…. About 34% of participants did not see any role for video visits in their medical care. These people were generally older, had lower incomes, lived in more-rural areas, and had lower education levels.”
Last month, GoodRx, in collaboration with the American Telemedicine Association released a new report: The State of Telehealth, examining the role the COVID-19 pandemic has played in reshaping virtual care and patient-provider interactions. The report is based on a survey of over 1,000 patients and more than 600 healthcare providers. The key takeaways summarized in their report are:
- The COVID-19 pandemic spurred telehealth use, and now both consumers and healthcare providers find value in virtual visits. Both report increased interaction and better outcomes.
- Many consumers find value in a hybrid model of care, which combines both in-person visits and telehealth.
- No-show rates for telehealth visits may be a pitfall for providers.
Other findings in their report included:
- About 40% of consumers reported they interacted more with providers because of telehealth appointments
- 40% of consumers noted that they spend more time with their providers
- Over 70% of providers said continuity of care was better or much better with telehealth
- More than 40% of providers reporting it was better than in-person care
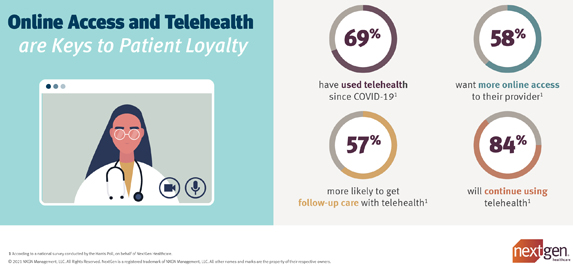
- Before the pandemic, 17% of consumers had used telehealth
- Now, over 60% of consumers plan on using a hybrid model that combines in-person and telehealth visits
- More than 80% of providers plan to continue offering telemedicine to patients
- 60% of providers said telehealth has improved medication adherence and resulted in better conversations about healthcare costs with patients
- 45% of providers indicated that no-show rates for telehealth appointments were higher or much higher than that of in-person rates
 Post a Comment By Riddle, Clive |