Search

Entries in Consumers (82)

Thursday
Nov042021

Dental and Vision Plan Satisfaction in 2021

By Clive Riddle, November 4, 2021

It’s time to see things eye-to-eye, and tell the tooth, about the state of vision and dental plan satisfaction. Setting Dad jokes aside, J.D. Power has just separately released their  2021 U.S. Dental Plan Satisfaction Report and their 2021 U.S. Vision Plan Satisfaction Report.

The J.D. Power Dental report tells us “overall customer satisfaction with dental plans increases slightly in 2021, driven by a combined 48-point increase in claims and reimbursement satisfaction (on a 1,000-point scale)  and customer service experience.” UnitedHealthcare Dental ranks highest with a score of 806. HumanaDental ranks second (793) and Aetna Dental ranks third (791).

Their vision report tells us “after a decrease in overall satisfaction in 2020, vision plan satisfaction is rebounding as doctor visits increase. Overall satisfaction is 769 (on a 1,000-point scale), an increase from 760 in 2020. Additionally, 5% more members visited their vision providers within the past six months compared with the same time in 2020.” UnitedHealthcare Vision ranks highest in customer satisfaction with vision plan insurers with a score of 825. Aetna Vision (816) ranks second and Davis Vision (775) ranks third.

The 2021 U.S. Dental Plan Satisfaction Report is based on responses from more than 1,203 dental plan members. The 2021 U.S. Vision Plan Satisfaction Report is based on responses from more than 1,110 vision plan members.

Both reports measure customer satisfaction applicable plans based on five factors (in order of importance): cost; coverage; communications; customer service; and reimbursement. coverage; cost; communications; customer service; and reimbursement.

Here are summaries that J.D. Power provided:

Thursday
May202021

Patients Want Two “T”s From Providers: Telehealth and Texting

By Clive Riddle, May 20, 2021

Results from two surveys were released this week on what U.S. patients want in their provider communications: telehealth and texting.

Harris Poll, on behalf of NextGen Healthcare, found that 53 percent "say the pandemic changed how they want to communicate with their doctor. Notably, nearly half (48 percent) indicate they would switch to a different healthcare provider if their current provider did not offer telehealth appointments." A HIMSS survey sponsored by SR Health found that “patients want more regular and immediate interactions with providers and to be more engaged in their overall healthcare and wellbeing. Nothing is more effective for that kind of communication than text. Ideally, today, every healthcare interaction should begin with a text message.”

The Harris Poll found "an overwhelming majority of U.S. patients who received telehealth services since March 2020 (84 percent) plan to continue using telehealth appointments in the future, citing reasons such as convenience (43 percent) or to avoid being around people who are ill (39 percent)." 57% say they would be more likely to get follow-up medical care if telehealth appointments were an option.

But beyond telehealth, the Harris Poll also addressed overall online access to providers. 58% of patients stated they want online access to their healthcare provider. Age plays a role in this: Patients from 18-54 are significantly more likely than patients 55 and older to say they would like to have more online access to their healthcare provider (68% under age 55 and 43% age 55+.) The wish list includes:

  • online appointment scheduling (49 percent)
  • ability to check-in or complete health forms/appointment paperwork online before an appointment (49 percent)
  • online prescription management (48 percent)
  • online medical records access (47 percent)

The HIMSS survey report: “Patient Communication Preferences in 2021,” concludes that "since the pandemic began, more regular communication is expected from healthcare providers. During the pandemic, emailing and texting healthcare providers has increased with almost half of patients saying they prefer to communicate with healthcare providers via text.”

Their survey found that:

  • Overall, 65 percent of people would like to receive healthcare text messages.
  • Text communication rose by 14 percent during the pandemic.
  • Eighty-seven percent of respondents said convenience was the reason they prefer messaging with providers.
  • More than one-third of patients would be willing to switch providers to receive more modern communication like real-time text messaging.
Wednesday
Sep302020

SDOH’s Cube - Compliments of Peter Kongstvedt

By Clive Riddle, September 30, 2020

Dr. Peter Kongstvedt over a decade ago, before Social Determinants of Health rose to more recent prominence, developed an illustration of how complex and intertwined the multitude of determinants are that impact a consumers' state of health, using the famous Rubik's Cube design as model.

Peter Kongstvedt, MD, FACP is a highly regarded national authority on the health care industry with particular expertise in health insurance and managed health care, and was recently emailing with me on the topic of SDoH, and shared his graphic from the past that he told me he'd "created many, many years ago in my attempts to increase awareness of the issue, though it wasn’t called SDoH then, so I grafted that on to the slide – just for you."

I was so taken with how applicable his blast from the past was for Social Determinants of Health, that I asked for his permission to share the illustration with you, so here you go - and think about applying other current determinant items as well that are being discussed in the world of SDoH, and how complex the variables are for any individual outcome - and you'll see the Rubik's challenge in front of those on the front lines of SDoH.

Friday
Feb072020

The Visits, They Are A-Changing

By Clive Riddle, February 7, 2020

Many facets of daily American life woven into the fabric of the Greatest Generation and Boomers have been gradually unraveling -  Attending church regularly, Belonging to service clubs, and Golfing for example. Is having a primary care doctor another?

The February issue of the Annals of Internal Medicine features the research article: Declining Use of Primary Care Among Commercially Insured Adults in the United States, 2008–2016.  The authors pose the issue, that despite well documented value to primary care visits and relationships, "there is early evidence of a decline in per capita primary care visit rates, and little is understood about what is contributing to the decline." They conclude: "commercially insured adults have been visiting PCPs less often, and nearly one half had no PCP visits in a given year by 2016. Our results suggest that this decline may be explained by decreased real or perceived visit needs, financial deterrents, and use of alternative sources of care."


Their study of 142 million primary care visits among 94 million member-years found that PCP visits declined 24.2%, from 169.5 to 134.3 visits per 100 member-years, while the proportion of adults with no PCP visits in a given year rose from 38.1% to 46.4%. Yet visit rates to specialists remained stable and visits to urgent care, retail clinics, and telehealth increased by 46.9%. They also found that the decline was largest among the youngest adults (−27.6%), healthier patients - those without chronic conditions (−26.4%), and lowest-income area residents (−31.4%).

Prior studies prompted the authors to examine this trend. Some previous indicators include:

  • A study published in the November/December 2019 issue of the Annals of Family Medicine: National Trends in Primary Care Visit Use and Practice Capabilities, 2008-2015, found that PCP visits per capita declined 20% during this time period, while visit duration increased 2.4 minutes per visit, and visits addresses 0.3 more diagnoses and 0.82 more medications per visit. The authors offered the hypothesis that “the decline in primary care visit rates may be explained in part by PCPs offering more comprehensive in-person visits and using more non–face-to-face care.”  But perhaps this could also be explained by an aging case mix (fewer younger people seeking visits) that require more visit intensity.

Further studies and time will tell how much of this generational shift away from PCP visits is due to alternative points of care,  vs. cost issues, vs. changes in perception of the value of primary care, or perhaps – just maybe – PCPs are doing too good a job with younger generations in communicating electronically via patient portals and other means, and participating in plans with nurse call line options and web based care information that renders the lowest level of primary care physician visits unnecessary.

Friday
Nov152019

Affordability and Coverage of Prescription Drugs for Seniors: A Gallup Poll and a KFF Study

by Clive Riddle, November 15, 2019

West Health and Gallup have just released results from a new survey on healthcare costs that found 13.4% of U.S. adults had “a friend or family member [who] passed away after not receiving treatment for their condition due to their inability to pay for it.” That percentage decreases with age: 16.9% under age 45, 12.4% between age 45 and 64 and 6.6% age 65%+  knew someone passing away.

That might seem counter-intuitive, given the greater frailty of seniors, but greater income levels compared to those under age 45, combined with stable coverage (Medicare) factor in. By income the percentages were 18.5% under $40k annually, 11.1% between $40k to $100k, and 9.1% over $100k.

Prescription drugs pricing was a particular focus in the survey, and “89% of U.S. adults report that drug prices are either ‘much higher’ or ‘somewhat higher’ than what consumers should be paying for them.” The survey found “28% of women vs. 18% of men have been unable to pay for prescription drugs;’ and that “medication insecurity skyrockets to 42% among those with annual household incomes of under $40,000.”

Today’s seniors have something the previous generation did not –the availability of  Medicare prescription drug coverage to help insulate from drug costs, and Kaiser Family Foundation has just released a new study: Medicare Part D: A First Look at Prescription Drug Plans in 2020.

Here’s eight things to know from KFF’s study:

  1. The average Medicare beneficiary will have a choice of 28 PDPs in 2020, a 29% increase from 2017
  2. A total of 948 PDPs will be offered in 2020, an increase of 202 PDPs since 2017.
  3. Among the 20 PDPs available nationwide, average premiums will range sixfold from a low of $13 per month for Humana Walmart Value Rx Plan to a high of $83 per month for Express Scripts Medicare Choice.
  4. Two-thirds of Part D enrollees without low-income subsidies will have premium increases in 2020 if they stay in their same plan, and one-third will have premium decreases.
  5. The estimated national average monthly PDP premium for 2020 is projected to increase by 7% to $42.05
  6. In 2020, all PDPs will have a benefit design with five or six tiers for covered generic, brand-name, and specialty drugs, and cost sharing other than the standard 25% coinsurance, similar to 2019.
  7. 86% of PDPs will charge a deductible, with most PDPs charging the standard deductible of $435 in 2020.
  8. Among all PDPs, median cost sharing is $0 for preferred generics and just $3 for generics, but $42 for preferred brands and 38% coinsurance for non-preferred drugs plus 25% for specialty drugs
Friday
Nov082019

Telling Tooth to Power: J.D. Power 2019 Dental Plan Satisfaction Report

by Clive Riddle, November 8, 2019

J.D. Power has just released its 2019 Dental Plan Satisfaction Report, which found that “customer satisfaction with dental plans increased in 2019, driven by year-over-year increases in coverage and communication experience,” with an overall satisfaction score in 2019 of 772 (on a 1,000-point scale) increasing from 768 in 2018.

The study found that DentaQuest (810 score) ranks highest, Blue Cross Dental/Blue Shield Dental (806 score) ranked second and HumanaDental (780 score) ranked third. The study noted “while most dental care providers included in the study typically provide insurance coverage through the customers’ employer, DentaQuest largely provides government plans.” Their report is based on survey responses from 1,400+ dental plan members.

The Kaiser Family Foundation Employer Health Benefits 2019 Annual Survey found that “among firms offering health benefits in 2019, 59% of small firms and 92% of large firms offer a dental insurance program to their workers separate from any plan included in their plan,” and that “sixty­three percent of firms offering a dental program to their workers make a contribution toward the cost of the coverage.”

The recently released 2020 Segal Health Plan Cost Trend Survey found that dental PPO plans were projected at 3.8% premium increases, dental maintenance organization plans at 3.5% increases, dental reference priced plans at 3.0% and dental FFS/indemnity plans at 4.1% increases. The report notes that dental benefits have "remained relatively unchanged for decades."

Here are the detailed results from the J.D. Power Dental Plan Satisfaction Report:

Friday
Nov012019

Measuring Telehealth Satisfaction: J.D. Power Study Finds Early Adopters Love It

by Clive Riddle, November 1, 2019

Telehealth use has progressed to the point where J.D. Power now has added the category to items included in their consumer satisfaction studies. The J.D. Power 2019 Telehealth Satisfaction Study finds that while “nationwide consumer adoption of telehealth services has been stubbornly low, with just 10% of healthcare consumers having used such services,” among those early adopters who are using telehealth, customer satisfaction with the experience ranks among the highest of any consumer category studied by J.D. Power.”

Greg Truex, Managing Director, Health Intelligence at J.D. Power offers this perspective: “Early attempts at trying to convince consumers to bank via their phone failed, and initiatives were abruptly canceled. Now, with mobile banking apps having grown to become the third-most-used application among consumers, we expect telehealth to follow a similar path. Telehealth offers an alternative avenue to receive quality care that is cost efficient and accessible. Once providers and payers refine the formula for awareness and adoption, telehealth will change the landscape of how affordable and quality care is delivered.”

J.D. Power found “the overall customer satisfaction score for telehealth services is 851 (on a 1,000-point scale), and is 900 or higher among 46% of telehealth users.,” and that “these customer satisfaction scores are among the highest of all healthcare, insurance and financial services industry studies conducted by J.D. Power. Only direct banking customer satisfaction ranks higher, with an average score of 855.”

Among direct-to-consumer brands, Teladoc ranked highest with a score of 870. Followed by Doctor on Demand (867) and MDLIVE (847). Among payers of health plan-provided telehealth services, Humana ranks highest with a score of 864, followed by Kaiser (863) and Cigna (862).


Additional J.D. Power study findings included:


  • 65% of telehealth users used the service because they received a positive recommendation from others, including friend, family or colleague (22%); health plan (21%); primary care doctor (20%); employer (18%); or health plan, hospital, or another provider (15%).
  • Among consumers who have not used telehealth, 29% indicate that telehealth is not available to them and 37% say they do not know if it is offered by their health provider or health system.
  • Self-reported availability is lowest in rural areas (25%).
  • 84% of telehealth users were able to completely resolve their medical concern(s) during their visit 
  • 73% of users did not experience any issues or problems during their service.
  • 49% of users say there were no barriers that made using telehealth difficult.
  • 87% of users describe the enrollment process as somewhat/very easy.
  • Users averaged 44 minutes for their entire experience, including: 17 minutes to complete the enrollment process, 9 minutes to wait for a physician or nurse practitioner and 18 minutes for the actual consultation. 


Tuesday
Oct222019

Thirteen Things to Know About the State of Vaping Use and Healthcare

By Clive Riddle, October 22, 2019


The CDC recently released numbers on vaping prevalence and health issues, which has been compiled along with their Electronic Cigarette Infographic Fact Sheet, to yield these thirteen things to know:


  1. As of October 8, 2019, 1,299 confirmed and probable lung injury cases associated with use of e-cigarette, or vaping, products were reported nationally
  2. As of that date, 26 deaths have been confirmed in 21 states
  3. The median age of patients who have died is 49 years, ranging from 17 to 75 years old.
  4. 76% of users reported using THC-containing products, with or without nicotine-containing products;
  5. 32% of users reported exclusive use of THC-containing products;
  6. 58% of users reported using nicotine-containing products, with or without THC-containing products
  7. 13% of users reported exclusive use of nicotine-containing products.
  8. 70% of users are male.
  9. 80% of users are under 35 years old.
  10. 15% of users are under 18 years old
  11. 21% of users are 18 to 20 years old.
  12. As of 2015, among all adult users 11.4% had never been regular cigarette smokers, but for age 18-24 40.0% had never been regular cigarette smokers
  13. In 2018, 4.9% of middle school and 20.8% of high school students had used e-cigarettes in the past    30 days, compared to a 2017 study citing 2.8% of all adults


Friday
Oct112019

High Deductible Plans, Absentee Employer Contributions and the Burden of Employee Cost Sharing

By Clive Riddle, October 11, 2019

Much is being said about the increasing burden of employee health insurance cost sharing, which continues to far outpace employee wage increases and other cost of living indexes. The prevalence of high deductible plans is often cited as a significant factor adding to this burden. Perhaps not enough is being said about the prevalence of employers that do not make any or adequate account contributions for such high deductible plans, and the role of these absentee employers in adding to the employee burden.

The current issue of MCOL's ThoughtLeaders asks "What are the stakeholder implications going forward arising from employee health plan cost sharing increasing at twice the rate of wages during the past decade?”

Lindsay Resnick, EVP at Wunderman Thompson Health opens his response by telling us the implications "can be summed-up on one word: OOPS…Out Of Pocket Spending. As corporate stakeholders – providers, payers, pharma and employers – joust in a ‘Game of Thrones’ battle over payment schemes, network configurations, price manipulation, and bureaucratic machinations, what about the ultimate stakeholder, America’s healthcare customer. For them, healthcare has become an amalgam of medical, financial and lifestyle transactions where they’re searching for value and grappling with mind-numbing personal decisions."

Natasha Elsner, Research Manager, Deloitte Center for Health Solutions comments that "high-deductible plans—that have become a common benefit option—are blunt instruments: they can discourage utilization of both low-value and high-value services, and such plans can be particularly challenging for people with ongoing health care needs, as well as those with low and even moderate incomes."

Dudley E. Morris, Senior Advisor, BDC Advisors notes that "compared to the press attention paid to Medicare-For-All, the escalating cost of large employer health plan insurance for working families is something of an elephant in the room in terms of the current political discourse."

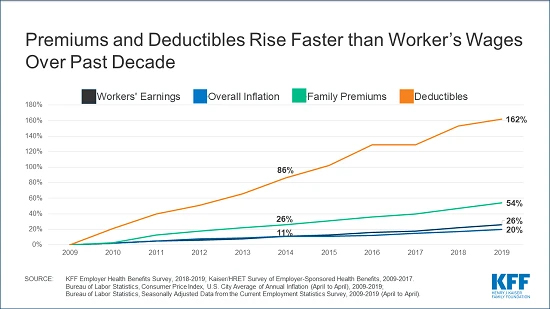
A couple of weeks ago Kaiser Family Foundation released its 2019 Employer Health Benefits Survey,  Their comprehensive report found that “"despite the nation’s strong economy and low unemployment, what employers and workers pay toward premiums continues to rise more quickly than workers’ wages and inflation over time. Since 2009, average family premiums have increased 54% and workers’ contribution have increased 71%, several times more quickly than wages (26%) and inflation (20%)."

Section Eight of their 238-page report covers “High-Deductible Health Plans with Savings Option.” They found that 28% of firms offering health benefits offer a HDHP with a HRA (Health Reimbursement Account) or Health Savings Account (HSA). 30% of covered workers are enrolled in an account based HDHP (20% in 20140; with 7% in HRAs and 23% in HSAs. The average general deductibles for HDHP/HRAs was $2,583 for single, and $5,335 for family, and the average firm contribution being $1,713 for singles (67% of the deductible) and $3,255 for family (61% of the deductible.) The HRA employer contribution could certainly be worse (although it should be noted HRAs are not portable after the employee leaves the company.)

The problem is that for HSAs, the contribution is worse, and that’s where most of the enrollees are. The average general deductibles for HDHP/HSAs was $2,476 for single, and $4,673 for family, and the average firm contribution being $572 for singles (23% of the deductible) and $1,062 for family (23% of the deductible.)  It isn’t that all employers are miserly -  the KFF report notes that “there is considerable variation in the amount that employers contribute to savings accounts.”

But the bigger problem beyond employer contributions averaging under one fourth of the deductible requirement, is that 55%pf employers offering qualified HDHP/HSA plans do not make any contribution. Many of these employers are small businesses, meaning the percentage of total employees receiving a contribution is better, but still – 25% of total single employees receive no contribution and 26% of families receive no contribution.

Looking at the contributions on a total dollar basis for all HSAs, the Devinir Midyear HSA Market Statistics & Trends report found that 31% of 2019 HSA contributions come from employers (52% from current employees, 13% from individuals, and 3% from IRA rollovers and Other.)

The problem caused by Absentee Employers and Miserly Employers when it comes to account contributions, is that the true promise and potential of consumer choice and engagement in health care decision making is severely compromised when the consumer doesn’t have the financial resources to make and engage in the options available. It is one thing for a consumer to make selections taking cost into consideration when they have an account that can fund an adequate portion of the cost involved – and their decisions involve allocating those funds and retaining any savings for future healthcare needs. If is quite another to make those decisions when they are burdened by deductibles that have skyrocketed over the past decade without the backing of adequate employer account contributions and don’t have the personal resources to cover that gap.

Friday
Sep272019

Healthcare Consumers on Technology and Decision Making: A Dozen Things To Know from a UnitedHealthcare Survey

by Clive Riddle, September 27, 2019

As healthcare consumers are about to embark into a decade, a new survey tells us they are turning even more to technology for health information, decision-making and purchasing. UnitedHealthcare has released results from their fourth-annual Consumer Sentiment Survey, which “examines Americans’ attitudes and opinions about multiple areas of health care, including open enrollment preparedness, technology and transparency trends and health literacy.” United tells us the study focuses on three areas: 1) Open Enrollment Preparedness; 2) Technology & Transparency Trends; and 3) Health Literacy & Consumer Preferences.


Here’s a dozen takeaways from the survey:

  1. A new-high 37% have used the internet or mobile apps to comparison shop for care (14% in 2012), including 50% of Millennials
  2. 46% cited a health care professional, such as a doctor or nurse, as the first source of information about specific health symptoms or ailments, and 20% first use the internet or a mobile app
  3. 39% who shopped online changed the facility or care provider (or both) as a result
  4. 64% “never” know the Rx costs before leaving the doctor’s office; 21%  “sometimes” know and 11% always know the price.
  5. 45% said they would be interested in their physician using AI in care decisions (including 55% of Millennials); and 28% were uninterested
  6. For those interested in AI support for physicians, 46% were motivated by the potential for a more accurate diagnosis; 31% cited the potential to reduce human error; and 15% hoped for faster treatment decisions
  7. 39% would likely use telemedicine in the future to access care (up 2 from 2016)
  8. 75% of those with benefits say they are prepared for the fall’s open enrollment season (down 2 points from last year) including 84% of Gen-Xers and 78% of Baby Boomers, but just 69% of Millennials and 44% of Gen-Z.
  9. 36% devote less than one hour to open enrollment; 27% spent between one and three hours; and 23% said more than three hours.
  10. 55% check if their doctors are in-network for the health plan they intend to select
  11. 59% successfully defined plan premium, 53% defined the meaning of deductible, while 335 could define out-of-pocket maximum and 21% define co-insurance
  12. 66% preferred speaking directly with a customer service representative to resolve health plan issues; and 10% preferred a self-service option through an app or online.
Friday
May102019

Consumer Insights and Kaiser Initiative on SDOH

By Clive Riddle, May 10, 2019

McKinsey has just published various insights from their 2019 Consumer Social Determinants of Health Survey, which found that compared to those whose social need is met, respondents (2,010 surveyed with government program coverage or uninsured and below 250% of federal poverty level) that:

  • Reported food insecurity were 2.4 times more likely to report multiple ER visits, and 2,0 times more likely to be hospitalized
  • Reported unmet transportation needs were 2.6 times more likely to report multiple ER visits, and 2,2 times more likely to be hospitalized
  • Reported unmet community safety needs were 3.2 times more likely to report multiple ER visits

Encouraging news from the survey for health plan advocates of SDOH was that 85% of respondents reporting unmet social needs said they would use a social program offered by their health insurer. Regardless of their social needs, respondents were interested in these types of health plan SDOH programs as follows: 

  • 50% were interested in grocery store discounts for healthy foods
  • 48% were interested in free memberships at local gyms
  • 45% were interested in a wellness dollar account used towards wellness services of their choice
  • 41% were interested in total reimbursement of home improvement purchases to address health issues
  • 40% were interested in after-hours drop-in clinics at lower or no cost 

Speaking of health plans, Kaiser Permanente has just announced their new Thrive Local initiative, a “a social care coordination platform” with “a network of public agencies and community-based organizations that will support” Kaiser “members to meet their social needs.”


Kaiser says that “starting this summer, closed-loop and bidirectional communication will provide confidence that referral, follow-up and ongoing patient/family engagement happen. Improved cross-sector collaboration and communication will also reduce the unintentional trauma and stigma that our patients and families may experience. Beyond Kaiser Permanente members and patients, community-based organizations will also benefit through improved decision support, automation, and relevance of the referrals they receive from their health system. This connectivity and interoperability between health care and social organizations and agencies will redefine the meaning of ‘provider network’ in this new world as the network of providers of health, health care, and social needs to address total health of our communities.”


Kaiser Permanente is partnering with Unite Us to launch the program, as tells us that Thrive Local within three years “will be available to all of Kaiser Permanente’s 12.3 million members and the 68 million people in the communities Kaiser Permanente serves.


Friday
Feb152019

Speaking Tooth to Power: J.D. Power Releases Dental Plan Satisfaction Report

By Clive Riddle, February 15, 2019 

J.D. Power has released their annual Dental Plan Satisfaction Report for 2018, which finds that “overall dental plan customer satisfaction has improved by 5 points (on a 1,000-point scale) to 775 from 2017.”  

J.D. Power reports that “DentaQuest (805) ranks highest, performing particularly well in the customer service, communication, and cost factors. HumanaDental (784) ranks second and myCignaDental (782) ranks third.” 

And just who is DentaQuest, who has now been ranked first for the third year in a row? They tout that they “manage dental and vision benefits for more than 27 million Americans and provide direct care to patients through our network of more than 85 oral health centers in five states,” and that they provide “dental solutions for Medicaid and CHIP, Medicare Advantage, small and large businesses and individuals throughout the U.S.” 

Steve Pollock, president and chief executive officer of DentaQuest.  Pollock says the company’s continued investment in technology and person-centered care solutions as reasons for the high customer satisfaction. “While it is incredibly gratifying to see the high satisfaction among our members, we know that true success means ensuring everyone has access to quality oral health care,” Pollock said. “Our Preventistry™ platform, which is a prevention-based approach that defines oral health as more than visits to the dentist, will ultimately improve oral health for all.”

Friday
Dec072018

Premium and Deductible Cost Sharing: A Dozen Key Findings from the Commonwealth Fund

by Clive Riddle, December 7, 2018 

CMS has just touted the National Health Expenditure growth of 3.9% for 2017 is at historic low levels, with the Office of the Actuary stating “prior to the coverage expansions and temporary high growth in prescription drug spending during that same period, health spending was growing at historically low rates. In 2017, health care spending growth returned to these lower rates and the health spending share of GDP stabilized for the first time since 2013.” 

Meanwhile, The Commonwealth Fund paints a different picture from another perspective, and has just released a 21-page DataBrief: The Cost of Employer Insurance Is a Growing Burden for Middle Income Families, with lead author Sara Collins commenting “The cost of employer health insurance premiums and deductibles continues to outpace growth in workers’ wages. This is concerning, because it may put both coverage and health care out of reach for people who need it most — people with low incomes and those with health problems. Policies that would reduce health care burdens on employees include fixing the Affordable Care Act’s family coverage glitch, requiring employers to exclude some services from the deductible, and increasing the required minimum value of employer plans.” 

The Commonwealth Fund tells us their study uses “the latest data from the federal Medical Expenditure Panel Survey–Insurance Component (MEPS–IC) to examine trends in employer premiums at the state level to see how much workers and their families are paying for their employer coverage in terms of premium contributions and deductibles. We examine the size of these costs relative to income for those at the midrange of income distribution.” 

Here’s a dozen key findings: 

  1. Average employee premium contributions for single and family plans amounted to nearly 7 percent of U.S. median income in 2017, up from 5 percent in 2008. 
  2. In 11 states (Arizona, Delaware, Florida, Georgia, Louisiana, Mississippi, Nevada, New Mexico, North Carolina, Oklahoma, Texas), premium contributions were 8 percent of median income or more, with a high of 10.2 percent in Louisiana.
  3. Premium and deductible costs amounted to nearly 12 percent of median income in 2017. Added together, the total cost of premiums to workers and potential spending on deductibles for both single and family policies climbed to $7,240 a year in 2017. 
  4. This combined cost ranged from a low of $4,664 in Hawaii to a high of more than $8,000 in eight states (Alaska, Arizona, Delaware, New Hampshire, North Carolina, South Dakota, Texas, Virginia). 
  5. In two states, Mississippi and Louisiana, these combined costs rose to 15 percent or more of median income.
  6. Premiums for employer health plans rose sharply in nearly every state in 2017. After climbing modestly between 2011 and 2016, overall premiums for employer health plans (employer and employee share) grew more sharply in 2017, by 4.4 percent for single plans and 5.5 percent for family plans. 
  7. Annual single person premiums rose above $7,000 in eight states (Alaska, Connecticut, Delaware, Massachusetts, New Jersey, New York, Rhode Island, Wyoming) and family premiums were $20,000 or higher in seven states (Alaska, Connecticut, Massachusetts, New Jersey, New York, West Virginia, Wyoming) and the District of Columbia. 
  8. Average premiums for families increased overall in 44 states and the District of Columbia.
  9. As employer premiums have risen, so have workers’ contributions. Between 2016 and 2017, employee premium contributions rose by 6.8 percent to $1,415 for single-person plans and by 5.3 percent to $5,218 for family plans.
  10. Contributions for single plans increased in 32 states, ranging from a low of $675 in Hawaii to a high of $1,747 in Massachusetts. 
  11. Contributions for family plans rose in 35 states and the District of Columbia, with the lowest increase in Michigan ($3,646) and the highest in Delaware ($6,533).
  12. The average deductible for single policies rose to $1,808 in 2017, a 6.6 percent increase. Average deductibles rose in 35 states and the District of Columbia, ranging from a low of $863 in Hawaii to a high of about $2,300 in Maine and New Hampshire.


Friday
Oct262018

Two Reports on Cost Driven Deferred Medical Care

By Clive Riddle

Two reports were published this week on deferred medical care driven by cost considerations, based on survey findings. Earnin’s report: Waiting to Feel Better: Survey Reveals Cost Delays Timely Care is based on two surveys – a commissioned online Harris Poll among over 2,000 U.S. adults and an Earnin poll of their users, “many of which live paycheck to paycheck.” AccessOne’s report: AccessOne Patient Finance Survey- Analysis on how healthcare costs impact is based on a survey conducted by ORC International of 693 people with at least $35,000 in annual household income, weighted by age, sex, geographic region, race and education.

Earnin tells that 54% of Americans “have delayed medical care for themselves in the past 12 months because they could not afford it, “ with the top three most delayed types of care being dental/orthodontic work (55%), eye care (43%), and annual exams (30%.) Earnin reports that “23 percen) have put off getting medical care for more than one year because they could not afford it. Among those whose household is living paycheck to paycheck or not making enough to get by, the rate of this extremely delayed care averages 36 percent. Nearly half of Americans (49 percent) say their health tends to take a back seat to other financial obligations.”


AccessOne reports that “Twenty-seven percent of households with children are likely to delay care because they can’t afford to pay for it.” Focusing on the dollar amounts involved and financing issues, they tell us that
  • 21% of families who had trouble paying their medical bill reported that their accounts had been sent to collections.
  • More than half of respondents were concerned about their ability to pay a medical bill of less than $1,000; with 35 percent being concerned about paying a bill that totals less than $500 – 20 times less than the average healthcare balance of a person in the U.S.
  • Only 21 percent of respondents said their healthcare providers have spoken to them about available patient financing options in the past two years.
  • Fifty-five percent of those surveyed said they prefer to discuss healthcare costs and financing options before care of service is delivered.
  • Fifty-four percent of those surveyed said they would use a no-interest financing option for a balance of $1,000 or less, and 57 percent said availability of a no-interest finance option is important or very important in evaluating a provider.
So if the AccessOne report implications bear out that improving financing options up front will reduce deferred medical care, the question is, will our younger generations that have had to assume much greater overall burden of college debt, also assume a growing burden of medical debt?


Wednesday
Jul252018

The Sounds of Silence

By Kim Bellard, July 25, 2018

Listen closely, healthcare organizations and professionals: those sounds you are not hearing are the voices of people not speaking up, including patients. And that’s a problem.

Let’s start with the elephant in the room: a new study found that even when physicians actually asked patients why they were there, on average they only listened to the patient’s explanation for eleven — that’s 11 — seconds before interrupting them.

Think about that, and then think back to a doctor’s visit you had about something that was worrying you: could you have explained it in eleven seconds?

Believe it or not, that’s not the worst of it. Only 36% of the time did patients even get a chance to explain why they were there. Even then, two-thirds of them were interrupted before they had finished.

Primary care doctors did better, allowing 49% of patients to explain their agenda for being there, versus only 20% for specialists. Hurray for the primary care physicians…

The researchers say there are many reasons why physicians aren’t listening better, including time constraints, burnout, and lack of communications training. But still…11 seconds? For the minority that even get the chance to talk?

As Bruce Y. Lee said in Forbes, “A doctor’s visit shouldn’t feel like a Shark Tank pitch.”

As bad as this is, it is not the only area where not feeling able to speak up is a problem in healthcare. For example, a study in BMJ Quality and Safety found that 50% to 70% of family members with a loved one in the ICU were hesitant to speak about common care situations with safety implications.

It’s not just patients who are silenced. One study found that 90% of nurses don’t speak up to a physician even when they know a patient’s safety is at risk. Another survey, of medical students in their final year of school, found that 42% had experienced harassment and 84% had experienced belittlement.

A couple of years ago ProPublicalooked at why physicians stay silent about other physicians they know commit medical errors, including ones who do so repeatedly. One physician, speaking about his hospital, told them:

There’s not a culture where people care about feedback. You figure that if you make them mad they’ll come after you in peer review and quality assurance. They’ll figure out a way to get back at you.

It’s about power: who has it, or at least who we think has it. We trust our doctors (although not as much as our nurses!). We assume that more experienced doctors have more knowledge than newer doctors, that doctors know more than nurses, and that healthcare professionals know more than we do. We’re at the bottom of the knowledge tree.

But that may not be true. Dave deBronkart — e-patient Dave — likes to cite Warner Slack’s great quote: “Patients are the most underused resource.”

But healthcare professionals must be willing to listen, and they must ensure that they ask. And we must take the initiative to speak up.

Our values are wrong if we allow reimbursement considerations to squeeze our time with physicians to the point we’re not talking and they’re not listening. Our values are wrong if we’re conditioned to think our opinions and concerns do not matter. Our values are wrong if everyone is not only empowered but also expected to speak up, especially when we see or experience something we think is a problem.

Anybody listening?

This post is an abridged version of the posting in Kim Bellard’s blogsite. Click here to read the full posting

Wednesday
May232018

Too Many Poor Excuses

Too Many Poor Excuses
 

By Kim Bellard, May 23, 2018


I am so tired of reading yet another story about how we — Americans — cannot afford things. Not luxury item. Increasingly, it seems like too many of us can’t afford what most people would consider basics — food, housing, child care, transportation.


And health care, of course.


new study by the United Way ALICE Project found that 51 million households can’t afford a basic monthly budget that includes food, housing, health care, child care, and a cell phone. That is 43% of all U.S. households.


ALICE stands for Assets Limited, Income Constrained, Employed. Of the 51 million households, two-thirds are ALICE ones. These are working households that, in a prior era, might have been thought of as middle class.


Now they are living paycheck to paycheck, and fearing sudden expenses — like an unexpected health care bills. Maybe they can’t afford their insulin, their inhalers, or their epipens anymore. And, of course, God forbid they end up in the emergency room or get out-of-network care.


Indeed, a hospital stay may result in a permanent reduction in income, even if you have insurance, according to a study released earlier this year. We shouldn’t be surprised that the Commonwealth Fund recently found that the percentage of Americans who feel confident they can afford the health care they need continues to fall. Only 62% re very or somewhat confident, down from 69% just three years ago. Twenty-four percent reported health care has become harder to afford over the last year.


Another new study found that 40% of us skipped a recommended test or treatment due to cost, and 44% skipped seeing a doctor when sick or injured due to concerns about costs. More feared the cost of a serious illness than they did the serious illness itself.


That is seriously wrong.


And there are no signs of anything improving. The number of uninsured is rising again. Actions by the Trump Administration to undermine the ACA exchange markets are estimated to have drastic increases on health insurance premiums — potentially jumping by 35% to 94% over the next three years. Plus, HHS has proposed rules for so-called short-term health insurance policies that the CMS


Actuary says will simply increase costs for everyone else, not to mention that those “covered” under those policies will find that coverage to be skimpy if/when they need it.


This all adds up. Kaiser Health News reports that, in addition to bankruptcies due to health care bills, nearly 40% of adults under 65 have had their credit scores lowered due to medical debts. A 2014 Consumer Financial Protection Bureau report found that almost 20% of credit reports had at least one medical collection account listed.


The sad truth is that only 39% of Americans say they could handle an unexpected expense of even $1,000 — and 34% had had a major unexpected expense over the past year. Not surprisingly, we are doing a terrible job saving for retirement. Increasingly, we’re both saying we’ll have to rely on Social Security for our retirement income, while lamenting that we’re not very confident it will be there when we need it.


These problems are not about our having enough money. We do. They are not just problems for “poor people.” They are problems for the majority of us. These are problems of priorities, and somewhere along the way our have gotten screwed up.


We’re making too many poor excuses for not doing more and for not doing better. It’s time to stop.
 
This post is an abridged version of the posting in Kim Bellard’s blogsite. Click here to read the full posting

 
Friday
May112018

The Disconnect with Consumers and Health Plan Costs

The Disconnect with Consumers and Health Plan Costs
 

By Clive Riddle, May 11, 2018


eHealth this week released a new eleven page report: Costs and Consequences in the ACA Market: A Survey of Individual and Family Health Insurance Consumers, presenting findings from more than 1,700 consumers who purchased their ACA-compliant plans via eHealth that included:  (1) “Consumers’ idea of a fair price is hard to find in today’s market;” (2) Policyholders aren’t willing to pay extra for key ACA benefits;” and (3) “Voters are bringing health care frustrations to the mid-term elections this fall,” (66% said it was one of their top three issues.)


Consistent with a number of previous studies, there is a significant disconnect between consumers sense of where healthcare prices should be in the market, and what they actually are. Health reports that the average individual monthly premium cost during the last open enrollment was $400,  Only 3% surveyed felt $400+ was a fair price. Only 9% felt $300+ was fair. Only 25% felt $200+ was fair. So what is fair? 38% felt premiums should be $100 or less. Another 36% felt $200 or less was fair.


The disconnect carries over consumer sense of the value of specific benefits. 61% want mental health benefits, 60% want maternity care and 55% want birth control coverage (which are all ACA required), but only 25%, 24% and 16% respectively, want to pay for them. Even emergency room benefits experience this disconnect: 80% want the benefit and 54% are willing to pay for it.


ACA compliant HDHPs are prevalent in the ACA marketplace, and continue to gain the large group environment as well. Benefitfocus this week released a new eleven page survey report: The State of Employee Benefits 2018 - Industry Edition that examined benefit trends for four sectors: education, health care, manufacturing and retail, with an emphasis on examining the impact of HDHPs in each sector.


Benefitfocus found that regarding HDHP prevalence by sector:

·         Education: 50% of employers offer HDHPs compared to 23% in 2016.

·         Healthcare: 73%% of employers offer HDHPs compared to 56% in 2016.

·         Manufacturing: 88%% of employers offer HDHPs compared to 54% in 2016.

·         Retail: 76%% of employers offer HDHPs compared to 55% in 2016.

·         All Industries: Healthcare: 70%% of employers offer HDHPs compared to 58% in 2016.


When large employers offer other type plans and HDHPs side by side (many employers do not offer both), the HDHP employee enrollment rates by sector were: Education: 34% (30% in 2016); Healthcare: 27% (23% in 2016); Manufacturing: 29% (46% in 2016); Retail: 40% (27% in 2016) and All Industries: 35% (40% in 2016).


What would drive such different results by sector? Employee premium HDHP contributions compared to last year decreased 27% in Education, increased 4% in healthcare, increased 46% in manufacturing, increased 20% in retail, and increased 4% overall for all industries.


So just as in the individual marketplace, much comes down to price, even though there is a disconnect in the value that price reflects.

 
Friday
Feb092018

Employees Feel Their Own Health Plan is Better Than Most Others

Employees Feel Their Own Health Plan is Better Than Most Others
 

By Clive Riddle, February 9, 2018

Surveys have consistently shown over the years that the public generally ranks Congress low in esteem, but their personal Congressman is held in higher regard. Health Plans, like Congress, have been a favorite target as well, but similarly – people tend to like their personal coverage more than how they view health plans overall.

AHIP has just released a 42-page report of findings from their national survey “The Value of Employer Provided Coverage” that not only reinforces this phenomenon – in which respondents rank their own plan higher than their overall view how health care is covered, but also makes the case that consumers place employer provided coverage in higher regard than the nation’s health coverage system as a whole. On top of that, there is perhaps less angst about the nation’s health insurance system overall than one might have thought.

63% were satisfied with the nation's current health insurance system, and 31% were dissatisfied. 71% were satisfied with their own health plan, and 19% were dissatisfied. 60% felt their personal cost was reasonable and 29% felt the cost was unreasonable, while 66% felt the cost was unreasonable for Americans as a whole. 52% described their deductible as reasonable, while 36% said it was unreasonable. However, for those dissatisfied with their plans, 82% cited costs as the main reason.

72% say they are adequately informed about health insurance benefits under their plan, yet only 20% understand that employers average paying above 75% of the total costs.

In other findings from the survey:

·         71% remain concerned the cost of health care will continue to rise

·         56% prioritize comprehensive benefits while 41% prioritize affordability of plans.

·         46%said health insurance was a deciding factor in choosing their current job

·         56% support keeping employer provided coverage tax free, and 13% oppose

·         58% prefer increased market competition while 42% support increased government involvement to address costs

·         Prescription drug coverage (51%), preventive care (47%), and emergency care (47%) rank among the benefits that matter most.

 
Friday
Jan122018

Accenture’s Advice to Pharma: It’s The Evidence, Stupid.

Accenture’s Advice to Pharma: It’s The Evidence, Stupid.
 

By Clive Riddle, January 12, 2018


Remember when Bill Clinton’s first presidential campaign mantra was “it’s the economy, stupid”?  Accenture advises the pharmaceutical industry to substitute evidence for economy in that equation and focus more on evidence-based solutions than products or brand.


Accenture has just released 16-page report: Product Launch: The Patient Has Spoken in which they conclude “brands are not major influencing factors when patients consider new pharmaceutical products. More than two-thirds (69 percent) of patients surveyed said the product’s benefits – i.e., treatment outcomes – are more important than the brand itself, with less than one-third (31 percent) citing a strong affinity to brands in a healthcare setting.”


Accenture tells us that for the report, they commissioned a survey of 8,000 patients in France, Germany, the U.K. and the U.S across eight therapeutic areas – immunology, cardiology, pulmonology, neurology, oncology, rheumatology, endocrinology and eye disease. Respondents represented three main age demographics: baby boomers, Gen Xers and millennials.


Accenture shared the following findings:


When patients were asked which factors influence their healthcare product and treatment decisions:

·         66% cited the doctor/physician relationship

·         55% indicated the ability to maintain their current lifestyle

·         53% said ease of access to the care they’ll need

·         But just 31% listed brand loyalty or popularity, and this ranked twelfth out of 14 influencing factors


The report notes that patient perspectives include:

·         38 % said they feel very knowledgeable about new or existing products coming to market for their condition

·         25 % reported having either very limited or no knowledge of new products that might be suitable for them

·         48 % believe that their doctors discuss the full range of product options with them

·         44 % feel that they have significant input into their treatment selection

·         63 % said they want to be involved in such decisions

·         47% said they’ve thought about switching their treatment at some point

·         62%of those who think about switching end up doing so


So if it isn’t product and brand, what does drive patient treatment choice decisions? Accenture says “despite survey results showing that many patients look online for information about new treatments, physicians remain the primary influencer of their treatment choices. In fact, the reason patients cited most often for switching treatments was a recommendation from their physician (cited by 81 percent of patients who switched treatments), followed by proven benefits compared to current treatment (79 percent) and fewer side-effects than their current treatment (78 percent).”


Regarding demographics, the survey “findings also identified differences in attitude and behavior by age group, with younger patients more likely than older ones to understand which treatments are available—and switch treatments when they believe there’s something better. For instance, while physician recommendation was the most-cited reason across all age groups for switching treatment, Millennials are almost twice as likely as Baby Boomers to be influenced by people posting alternative treatment options on social media.”


Of course what the report doesn’t focus on regarding treatment decisions is the role of insurance coverage, cost-sharing and formularies. But Accenture’s message in this value based era should still resonate. Accenture’s Jim Cleffi, a co-author of the report, tells us “given the significant budgets pharmaceutical companies devote to driving brand equity in the marketplace, our report findings should be a strong signal to the industry that launch strategies need to change. Patients in our study made it clear that outcomes matter most which means that pharma companies should focus their launch strategies and communications more on patient value and impact versus the brand—and do so in a much more precise and personalized way. Reallocating parts of launch budgets to programs that resonate the most with different patient segments would not only better meet patients’ needs and deliver better outcomes, but likely provide the companies with better ROI.”


Accenture provides pharma two recommendations in the report:

1)    Bring an outcome – not just a product – to market. Patients value outcomes over brands, so instead of launching just products, pharmaceutical companies should start launching evidence-based solutions, or products with services as a secondary offering. This will require collaborative data-sharing – between patients, providers and payers – along with advanced analytics to generate robust insights and delivery via digital channels. This mindset should begin at the clinical trial-stage so it informs new launch strategies and full commercialization.

2)    Make it personal and precise. One size no longer fits all; pharmaceutical companies need to understand patient sub-segments and develop value-driven launch strategies tailored to each segment. Harnessing advanced analytics and other new technologies that leverage the proliferation of health data will help enable companies to modify launch strategies that make new treatments more relevant to patients while also driving better-informed resource and investment allocations.

 
Thursday
Dec072017

Are your healthcare consumers who they say they are?

By Claire Thayer, December 7, 2017


Verifying healthcare consumer identities has become enormously complex requiring sophisticated advanced authentication technology.  A HIMSS report on Patient Portal Identity Proofing and Authentication, tells us that the National Institute of Standards and Technology (NIST) identifies three factors as the cornerstone of identity authentication:


• Something you know (for example, a password)

• Something you have (for example, an ID badge or a cryptographic key)

• Something you are (for example, a fingerprint or other biometric data)


Multi-factor authentication refers to the use of more than one of the factors listed above, which NIST requires to reach a high level of confidence in authentication.  At least one of the factors must contain a secret that is securely presented to the electronic process that is verifying the user’s identity.  A second factor can be used to protect or activate the first. In this guidance report, the HIMSS Identity Management Task Force suggests that incorporation of smartphones as a second factor into the processes of identity proofing and authentication will significantly improve the security of electronic interactions with patients while minimizing the additional cost and difficulty.

This recent edition of the MCOL Infographic and e-Brief, co-sponsored by LexisNexis, focused on the intricacies, complexities and challenges involved with identity management:


MCOL’s weekly infoGraphoid is a benefit for MCOL Basic members and released each Wednesday as part of the MCOL Daily Factoid e-newsletter distribution service – find out more here.