Search

Entries in health plans (88)

Thursday
Jun132019

Analyzing Blue Cross Blue Shield Plan Administrative Costs

By Clive Riddle, June 13, 2019

Sherlock Company in the June issue of their Plan Management Navigator examines administrative cost trends for Blue Cross Blue Shield Plans, analyzing year end 2018 vs 2017 data.  They found that costs “increased by 5.5% per member, up from an increase of 5.1% for 2017. Reweighting to eliminate the effects of product mix differences between the years, per member costs increased by 6.7% as compared with 5.9% in 2017. ASO/ASC increased as commercial insured membership declined. Medicare Advantage continued to grow rapidly.”

 Their key findings included:

  • Most clusters of expenses grew at rates less than last year.
  • Uniquely, Account and Membership Administration’s growth rate increased.
  • Growth in Information Systems was the single most important reason for administrative expense increase in 2018.
  • The shift in favor of products and market segments that are lower cost to administer muted the real growth.


Sherlock’s benchmarking study “analyzes in-depth surveys of 14 Blue Licensees serving 37 million members. Surveyed Plans comprise 52% of the members of Blue Cross Blue Shield Plans not served by publicly-traded companies.” 

Why does this benchmarking matter? Because the non-publicly traded BCBS plans provide a meaningful universe to benchmark, and plan administrative expenses are highly scrutinized, and certainly more controllable than medical expenses. As Doug Sherlock states, “in the current environment, optimizing administrative expenses is a high priority for health plan managers. Plans have completed their adaptation to the Affordable Care Act and the bulge in Exchange and Medicaid members. Plus, administrative expense visibility has been heightened by the rhetoric of presidential candidates.”

Here’s some key specific data from their report:


  • For the universe as a whole, the median total costs were $38.51 per member per month, higher than last year’s $34.99. 
  • By functional area, median pmpm costs were: Sales & Marketing $9.21; Medical & Provider Management $5.03; Account and Membership Administration $16.10 and Corporate Services $5.92
  • Median pmpm costs by product categories included: Commercial insured $49.84; Commercial ASO $28.32; Medicare Advantage $112.08; and Medicaid $46.08.
  • The median administrative expense ratio was 9.0% compared with 8.9% last year.
  • The median administrative expense ratio by product categories included: Commercial insured 10.8%; Commercial ASO 7.1%; Medicare Advantage 12.5%; and Medicaid 9.3%.
  • Staffing ratios increased by 6.8%, especially in Information Systems. 
  • Approximately 19 FTEs serve every 10,000 members in the commercial products. 
  • Compensation, including all benefits except OPEB, increased at a median rate of 3.8%. 
  • The median proportions of FTEs that were outsourced was 11.0%.
  • After the effect of the Miscellaneous Business Taxes, total administrative expense PMPM increased by 17.9% compared with a decline of 2.3% in the prior year 


Friday
May312019

ACA Exchange 2020 Final Rule Changes and Survey of Exchange Health Plan Participation and Expectations

By Clive Riddle, May 31, 2019 

Last month CMS issued their final rule with ACA benefit and payment parameters for 2020. Their changes for 2020 included: 

  • The method for calculation of premium assistance for lower-income enrollees (projected to lower the total amount of financial assistance provided by $900 million, when compared with 2019, and result in 100,000 fewer exchange enrollees in 2020.)
  • Allowing plans to make mid-year changes to their drug formularies
  • Allowing plans to implement cost-sharing requirements if enrollees choose a brand-name drug when a medically appropriate generic version of the drug is available (even when out-of-pocket spending maximum is reached)
  • Allowing plans to implement copayment accumulator programs for prescription drugs
  • Lowering user fees for the 2020 coverage year by half a percentage point
  • Increases maximum out-of-pocket spending limits by 3.2%, from $7,900 to $8,150 for individual plans and from $15,800 to $16,300 for family plans      


How will these changes, and overall market forces, impact health plan participation in the ACA exchanges for 2020? eHealth has just released survey results from 17 plans that collectively cover 80 million lives that participate in ACA exchanges, that found “more than twice as many insurers intend to increase plan offerings for 2020 as compared with 2019, with premiums holding fairly steady.”


Here’s some of their detailed findings: 

  • 45% intend to add to the number of ACA plans they'll offer in 2020, compared to 21% who did so for the 2019 plan year
  • 42% expect to raise premiums between 5 and 10 percent over 2019 rates. 33% do not expect to make any noteworthy changes to premiums, while 23% expect to reduce monthly premiums by 5 percent or more.
  • 69% said that sales during the last open enrollment period were within 10 percent of their expectations. 15% reported that sales outpaced expectations by 10 to 15 percent, while another 15% of said sales were 10 percent or more below expectations.
  • 71% said they are paying attention to public discussions about "Medicare for all" but don't expect major changes, compared to 67% in 2018


Friday
May102019

Consumer Insights and Kaiser Initiative on SDOH

By Clive Riddle, May 10, 2019

McKinsey has just published various insights from their 2019 Consumer Social Determinants of Health Survey, which found that compared to those whose social need is met, respondents (2,010 surveyed with government program coverage or uninsured and below 250% of federal poverty level) that:

  • Reported food insecurity were 2.4 times more likely to report multiple ER visits, and 2,0 times more likely to be hospitalized
  • Reported unmet transportation needs were 2.6 times more likely to report multiple ER visits, and 2,2 times more likely to be hospitalized
  • Reported unmet community safety needs were 3.2 times more likely to report multiple ER visits

Encouraging news from the survey for health plan advocates of SDOH was that 85% of respondents reporting unmet social needs said they would use a social program offered by their health insurer. Regardless of their social needs, respondents were interested in these types of health plan SDOH programs as follows: 

  • 50% were interested in grocery store discounts for healthy foods
  • 48% were interested in free memberships at local gyms
  • 45% were interested in a wellness dollar account used towards wellness services of their choice
  • 41% were interested in total reimbursement of home improvement purchases to address health issues
  • 40% were interested in after-hours drop-in clinics at lower or no cost 

Speaking of health plans, Kaiser Permanente has just announced their new Thrive Local initiative, a “a social care coordination platform” with “a network of public agencies and community-based organizations that will support” Kaiser “members to meet their social needs.”


Kaiser says that “starting this summer, closed-loop and bidirectional communication will provide confidence that referral, follow-up and ongoing patient/family engagement happen. Improved cross-sector collaboration and communication will also reduce the unintentional trauma and stigma that our patients and families may experience. Beyond Kaiser Permanente members and patients, community-based organizations will also benefit through improved decision support, automation, and relevance of the referrals they receive from their health system. This connectivity and interoperability between health care and social organizations and agencies will redefine the meaning of ‘provider network’ in this new world as the network of providers of health, health care, and social needs to address total health of our communities.”


Kaiser Permanente is partnering with Unite Us to launch the program, as tells us that Thrive Local within three years “will be available to all of Kaiser Permanente’s 12.3 million members and the 68 million people in the communities Kaiser Permanente serves.


Friday
Feb152019

Speaking Tooth to Power: J.D. Power Releases Dental Plan Satisfaction Report

By Clive Riddle, February 15, 2019 

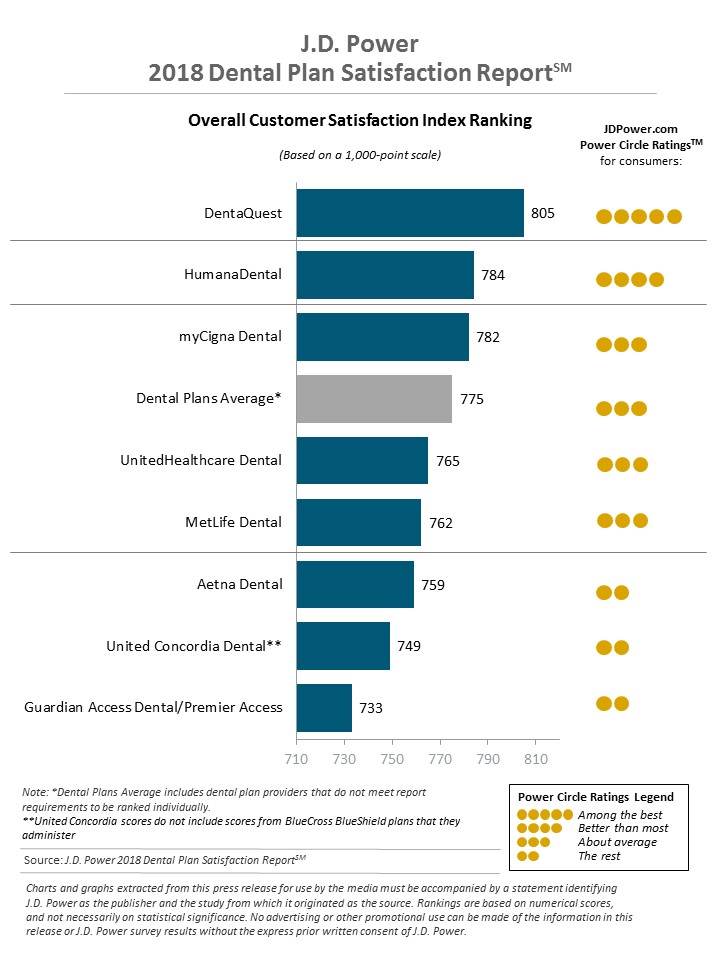
J.D. Power has released their annual Dental Plan Satisfaction Report for 2018, which finds that “overall dental plan customer satisfaction has improved by 5 points (on a 1,000-point scale) to 775 from 2017.”  

J.D. Power reports that “DentaQuest (805) ranks highest, performing particularly well in the customer service, communication, and cost factors. HumanaDental (784) ranks second and myCignaDental (782) ranks third.” 

And just who is DentaQuest, who has now been ranked first for the third year in a row? They tout that they “manage dental and vision benefits for more than 27 million Americans and provide direct care to patients through our network of more than 85 oral health centers in five states,” and that they provide “dental solutions for Medicaid and CHIP, Medicare Advantage, small and large businesses and individuals throughout the U.S.” 

Steve Pollock, president and chief executive officer of DentaQuest.  Pollock says the company’s continued investment in technology and person-centered care solutions as reasons for the high customer satisfaction. “While it is incredibly gratifying to see the high satisfaction among our members, we know that true success means ensuring everyone has access to quality oral health care,” Pollock said. “Our Preventistry™ platform, which is a prevention-based approach that defines oral health as more than visits to the dentist, will ultimately improve oral health for all.”

Friday
Feb012019

Taking a Peek Inside The Profit Margins and Administrative Expenses in BCBS World

By Clive Riddle, February 1, 2019

Mark Farrah Associates has released analysis of major Blue Cross Blue Shield plan profitability performance, comparing year-over-year results as of September 30, 2018. They note that “BCBS plans with over $10 million in revenue at third quarter 2018 include Anthem, Health Care Service Corp. (HCSC), Blue Shield of CA, BCBS of Michigan Group, Guidewell Mutual Holding Group, Independence Blue Cross (IBX), and Highmark.  These industry leaders reported positive, and in most cases, improved profitability between 3Q17 and 3Q18.”

Their findings include:

  • BCBS of Michigan’s “profit margin increased nearly 3% from 5.43% in 3Q17 to 8.31% in 3Q18 due to premium growth that outpaced the increase in medical expenses and an income tax credit taken in 2018.” 
  • Guidewell’s “profit margin grew to 5.33% from 4.71% in September of 2017, primarily due to increased premium revenue, which outpaced the growth of expenses.”
  • Independence Blue Cross (IBX) “reported the largest improvement with a profit margin of 2.29% as of September 30, 2018, up from 0.30% in September of 2017 due in part to increased premium revenue and reduced medical costs per member.”
  • Blue Shield of CA “increased its profit margin to 3.36% from 2.81% due in part to lower medical costs per member.”
  • Health Care Service Corp (HCSC) “reported the largest profit margin of 14.21% for 3Q18, up from 6.10% in 3Q17 due to an increase in premium revenue and a large income tax credit.”
  • Highmark’s “profit margin of 6.62% in 3Q18 fell slightly from 7.11% in 3Q17 due in part to increased administrative spending.” 
  • Anthem’s “3Q18 profit margin of 5.66% improved from 4.52% a year ago due in part to a combination of slightly lower medical expenses and higher premium revenue per member.”

Being administrative expenses are such an important factor in plan profitability, it’s worthwhile to examine BCBS performance in this arena. Sherlock Company annually examines BCBS plans with respect to their administrative expenses, with their most recent report published in summer 2018

Results aren’t published by plan, but rather are aggregated for the BCBS sector. Overall, administrative costs increased 5.9% for 2017. Their 2017 median benchmark findings include: 

  • Sales and Marketing: $8.79 pmpm; 2.0% of premium
  • Medical and Provider Management: $4.44 pmpm; 1.3% of premium
  • Account and membership Administration: $14.66 pmpm; 4.0% of premium
  • Corporate Services: $6.27 pmpm; 1.6% of premium
  • Total administration: $34.99 pmpm; 8.9% of premium
  • Total administration pmpm by product line:  Commercial HMO $48.87; Commercial PPO $43,85; Commercial ASO $27.13; Medicare Advantage $97.63; Medicaid $43.22
  • Total administration % of premium by product line:  Commercial HMO 8.6%; Commercial PPO 10.1%; Commercial ASO 7.7%; Medicare Advantage11.3%; Medicaid 9.3%


Friday
Sep282018

NCQA Health Plan Ratings: What About the 25% With No Rating?

By Clive Riddle, September 28, 2018

NCQA has released its 2018-2019 Health Insurance Plan Ratings. The ratings are a key tool used by stakeholders in evaluating health plans. NCQA tells us they “studied nearly 1,500 health plans and rated 1,040: 445 private (commercial), 418 Medicare and 177 Medicaid” and that “of the 1,040 rated plans, 85 (8%) received a top rating of 4.5 or 5.0 out of 5. Twenty-five (2%) earned the ratings of 1.0 to 2.0.”

The ratings website is searchable by plan type, state, or plan name and can be sorted by ratings (rated on a scale of 1.0 to 5.0). What isn’t readily available is a summary of the number of plans by each rating category, so we compiled one:

What struck us was the 25% of plans studied that aren’t rated. If you’re a plan that likely would get a rating below 3.0, wouldn’t you be motivated to avoid being rated at all? So let’s look at the ratings methodology.  Here’s a summary of NCQA health plan rating methodology, provided by NCQA

“Health plans are rated in three categories: private plans in which people enroll through work or on their own; plans that serve Medicare beneficiaries in the Medicare Advantage program (not supplemental plans); and plans that serve Medicaid beneficiaries. This year’s ratings do not include Marketplace plans because they have not developed sufficient data for analysis. NCQA ratings are based on three types of quality measures: measures of clinical quality from NCQA’s Healthcare Effectiveness Data and Information Set (HEDIS®2); measures of consumer satisfaction using Consumer Assessment of Healthcare Providers and Systems (CAHPS®3); and results from NCQA’s review of a health plan’s health quality processes (performance on NCQA Accreditation standards). NCQA rates health plans that report quality information publicly.”

NCQA provides this explanation of plans listed as having partial data:

“Plans with partial data do not receive a rating, but NCQA lists them in the ratings and shows their scores on the measures they report. A plan is considered to have partial data if it: Submits HEDIS and CAHPS measure data for public reporting, but has “missing values” (i.e., NA or NB) in more than 50 percent of the weight of measures used in the methodology. Plans that fall into this category receive an overall rating status of “Partial Data Reported” and their measure rates are displayed as “NC” (No Credit). Refer to HEDIS Volume 2: Technical Specifications for information about missing values. Submits HEDIS data for public reporting but does not submit CAHPS data, or vice versa. Plans that fall into this category receive an overall rating status of “Partial Data Reported” and their measure rates for the dataset they did not submit are displayed as “NC” (No Credit).  Earned NCQA Accreditation without HEDIS data (health plan accreditation standards only) and did not submit HEDIS or CAHPS data for public reporting. Plans that fall into this category receive an overall rating status of “Partial Data Reported” and their measure rates are displayed as “NC” (No Credit).”

NCQA provides this explanation of plans listed as having no data reported:

“Plans that submit results but do not report data publicly, or plans that report no HEDIS, CAHPS or accreditation information to NCQA, are given a rating status of “No Data Reported” and their measure rates are displayed as “NC” (No Credit). Plans that fall into this category and have fewer than 8,000 members are omitted—they are not rated and are not listed in displays related to ratings.”

Based on these explanations, there are plans that legitimately should not be rated. But some of these aren’t included in the above numbers of plans with partial or no data, such as plans with fewer than 8,000 members with no data reported, or Marketplace plans with not enough data history.

But what about the rest? Could there be plans that avoid full data reporting to avoid potentially low ratings? Certainly the small numbers of plans publicly singled out with 2.0 or lower ratings come across looking far worse that the large number of plans listed with partial data or no data reported.

Perhaps NCQA should come up with a way to make the listings of applicable partial or no data reported plans perceived in a more negative manner?

Friday
Sep142018

Post ACA Operating Margins: Health Systems and Health Plans

By Clive Riddle, September 14, 2018

Navigant this week released an eight-page report: Stiffening Headwinds Challenge Health Systems to Grow Smarter, that provides “an analysis of a three-year sample of the financial disclosures of 104 prominent health systems operating 47% of U.S. hospitals,” in which Navigant  “found broad-based and significant deterioration of operating earnings.”


Navigant reports that from 2015 to 2017:

  • The average operating margin decline for analyzed systems was 38.7%. Not-for-profit system margins fell 34%, while for-profit margins fell 39%.
  • 65% of systems experienced operating income declines totaling $6.8 billion, with the most significant reductions occurring in the U.S.’s fastest-growing regions: West/Southwest and South Central.
  • At the root of these declines were multiyear reductions in the rate of topline operating revenue growth, which fell from 7% (2015 to 2016) to only 5.5% (2016 to 2017), and a failure to contain expenses in line with revenue deterioration. 

Navigant cites these drivers of earnings deterioration:

  1. Weakening demand for such core hospital services as surgery and inpatient admissions, due in part to rising patient cost exposure from high-deductible health plans;
  2. Deteriorating collection rates for private accounts in non-ACA expansion states;
  3. Steady erosion in Medicare payment rates due to the ACA and the 2012 federal budget sequester; and
  4. Failure of health system value-based insurance contracts to deliver sufficient patient volume to offset steep upfront payer discounts and significant hospital population health investments.

Meanwhile on the other side of the post-ACA equation, Mark Farrah Associates this week “released an analysis brief providing insights into mid-year profitability for commercial and government lines of health insurance business. MFA compared second quarter, year-over-year profitability for the Individual, Employer-Group, Medicare and managed Medicaid segments.”

They found that:

  • At the end of second quarter 2018, the average medical expense ratio for the Individual segment was 70.8%, as compared to 77.2% the previous year.
  • Growth in premiums pushed the average medical expense ratio for the Employer-Group segment down to 80.9% for 2Q18 from 81.8% in 2Q17.
  • For Medicare Advantage, premium growth outpaced increases in medical expenses pushing the medical expense ratio down to 85.3% from 86.1% in 2Q17.
  • 2.9% increase in premiums per member per month pushed the medical expense ratio for Managed Medicaid down to 88.6% from 91.0% in 2Q17.

Mark Farrah Associates concludes the current outlook is better than the one Navigant finds for health systems: “At the mid-year point, all four health care segments are signifying improved profitability for health insurers over 2017.  The most significant change is once again in the Individual segment showing improvement over 2017, which ended up being a profitable year for the segment overall.  While this analysis of mid-year segment performance sheds light upon profitability trends for 2018, it’s a wait and see proposition until final financial results are revealed in spring of 2019.”

Friday
May182018

Six Things To Know From Deloitte Research on Health Plan Government Business

Six Things To Know From Deloitte Research on Health Plan Government Business
 

By Clive Riddle, May 18, 2018


This week, Deloitte Center for Health Solutions’ Andreea Balan-Cohen, Ph.D., and Maulesh Shukla gave a presentation on Medicare Advantage and Medicaid Managed Care Trends: Deloitte Research in a live HealthcareWebSummit event.


The basis for their discussion was Deloitte Center for Health Solutions analysis of financial performance trends in the US fully insured health plans market between 2011 and 2016. This research series was divided into three chapters: Chapter 1, published in December 2017, provided summary observations on overarching developments in the market. Chapter 2, published in March 2018, focused on trends in health plan government programs, specifically Medicare Advantage and Medicaid managed care. Chapter 3, forthcoming later this month, will focus on trends in the commercial individual and commercial group lines of business.


Here’s six key findings they shared on U.S. health plans’ government business:

1.     Government programs accounted for a large and growing share of health plan revenue and underwriting gains.

2.     The Medicare Advantage business experienced significant top-line growth and bottom-line volatility, including a notable decline in underwriting performance in 2014 and 2015.

3.     In Medicaid managed care, aggregate plan revenue increased steadily between 2011 and 2016, and underwriting performance grew impressively before retrenching in 2016.

4.     The largest Medicare and Medicaid plans by national revenue captured a disproportionate and growing share of industry underwriting gains.

5.     Medicare Advantage performance variation widened beginning in 2014; smaller plans and newer entrants experienced substantial headwinds.

6.     Medicaid managed care markets exhibited widening performance variation at the company and state levels beginning in 2014.

 
Thursday
May172018

Medication Nonadherence: Data and Analytics Can Make an Impact

By Claire Thayer, May 16, 2018

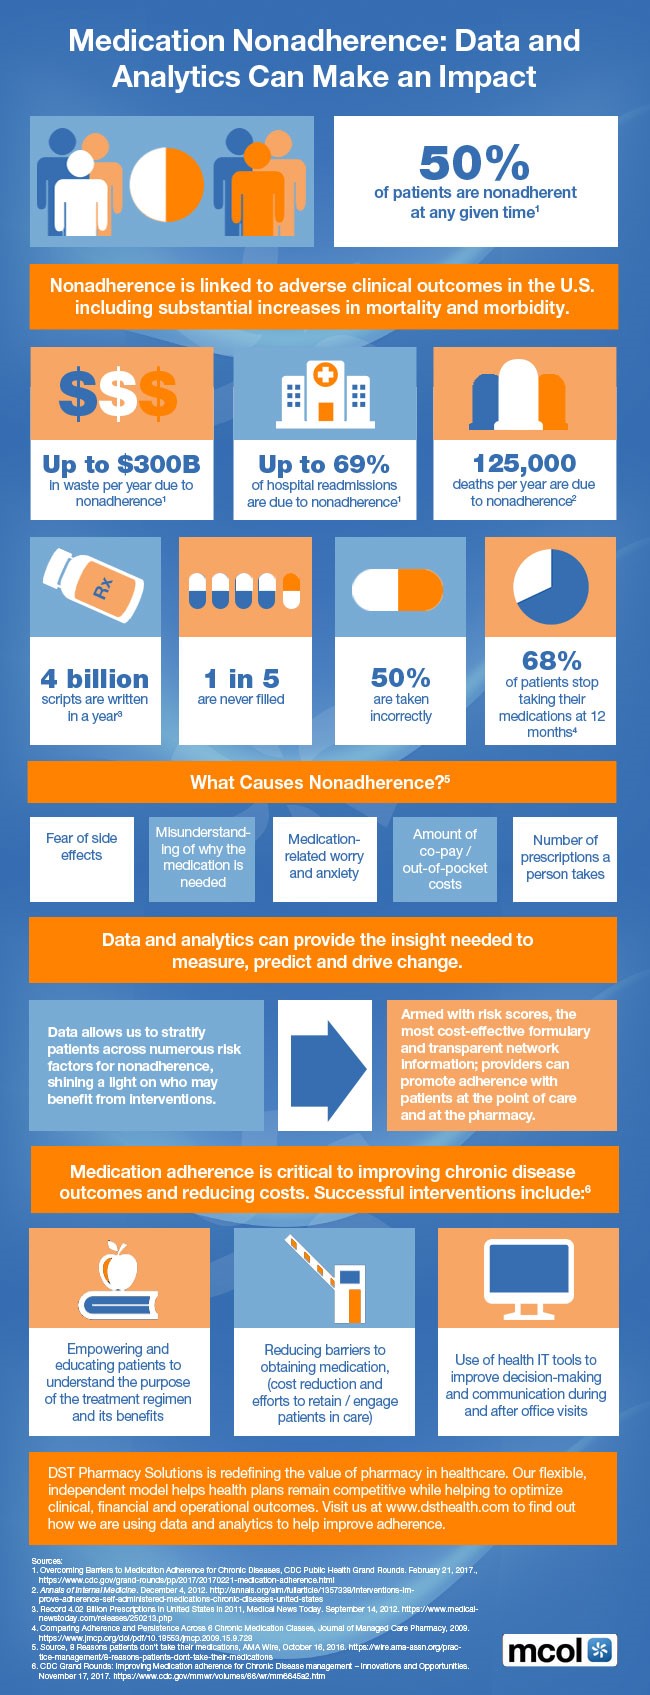
Over two-thirds of hospital readmissions are directly due to medication nonadherence.  Many factors contribute to patients not taking their medications, including fear of side effects, out-of-pocket costs, and misunderstanding intended use.  Interventions targeted at understanding the underlying causes on nonadherence are critical to improving chronic disease outcomes.  Successful interventions include: educating patients on purpose and benefits of treatment regimen, reducing barriers to obtain medication, as well as use of health IT tools to improve decision making and communication during and after office visits. 

This weeks’ edition of the MCOL infoGraphoid, co-sponsored by DST Health, explores how data and analytics can provide insight to drive behavior change to improve adherence.

MCOL’s weekly infoGraphoid is a benefit for MCOL Basic members and released each Wednesday as part of the MCOL Daily Factoid e-newsletter distribution service – find out more here.

Friday
May112018

The Disconnect with Consumers and Health Plan Costs

The Disconnect with Consumers and Health Plan Costs
 

By Clive Riddle, May 11, 2018


eHealth this week released a new eleven page report: Costs and Consequences in the ACA Market: A Survey of Individual and Family Health Insurance Consumers, presenting findings from more than 1,700 consumers who purchased their ACA-compliant plans via eHealth that included:  (1) “Consumers’ idea of a fair price is hard to find in today’s market;” (2) Policyholders aren’t willing to pay extra for key ACA benefits;” and (3) “Voters are bringing health care frustrations to the mid-term elections this fall,” (66% said it was one of their top three issues.)


Consistent with a number of previous studies, there is a significant disconnect between consumers sense of where healthcare prices should be in the market, and what they actually are. Health reports that the average individual monthly premium cost during the last open enrollment was $400,  Only 3% surveyed felt $400+ was a fair price. Only 9% felt $300+ was fair. Only 25% felt $200+ was fair. So what is fair? 38% felt premiums should be $100 or less. Another 36% felt $200 or less was fair.


The disconnect carries over consumer sense of the value of specific benefits. 61% want mental health benefits, 60% want maternity care and 55% want birth control coverage (which are all ACA required), but only 25%, 24% and 16% respectively, want to pay for them. Even emergency room benefits experience this disconnect: 80% want the benefit and 54% are willing to pay for it.


ACA compliant HDHPs are prevalent in the ACA marketplace, and continue to gain the large group environment as well. Benefitfocus this week released a new eleven page survey report: The State of Employee Benefits 2018 - Industry Edition that examined benefit trends for four sectors: education, health care, manufacturing and retail, with an emphasis on examining the impact of HDHPs in each sector.


Benefitfocus found that regarding HDHP prevalence by sector:

·         Education: 50% of employers offer HDHPs compared to 23% in 2016.

·         Healthcare: 73%% of employers offer HDHPs compared to 56% in 2016.

·         Manufacturing: 88%% of employers offer HDHPs compared to 54% in 2016.

·         Retail: 76%% of employers offer HDHPs compared to 55% in 2016.

·         All Industries: Healthcare: 70%% of employers offer HDHPs compared to 58% in 2016.


When large employers offer other type plans and HDHPs side by side (many employers do not offer both), the HDHP employee enrollment rates by sector were: Education: 34% (30% in 2016); Healthcare: 27% (23% in 2016); Manufacturing: 29% (46% in 2016); Retail: 40% (27% in 2016) and All Industries: 35% (40% in 2016).


What would drive such different results by sector? Employee premium HDHP contributions compared to last year decreased 27% in Education, increased 4% in healthcare, increased 46% in manufacturing, increased 20% in retail, and increased 4% overall for all industries.


So just as in the individual marketplace, much comes down to price, even though there is a disconnect in the value that price reflects.

 
Friday
May042018

Welcome to Lifestyle Medicine

By Clive Riddle, May 4, 2018 

The May issue of Circulation includes the research article: Impact of Healthy Lifestyle Factors on Life Expectancies in the US Population, which presented findings from a study that aimed “to estimate the impact of lifestyle factors on premature mortality and life expectancy in the US population.” 

Using data from previous studies they defined five low-risk lifestyle factors

  1. never smoking
  2. ≥30 min/d of moderate to vigorous physical activity
  3. moderate alcohol intake
  4. a high diet quality score (upper 40%)

The study “estimated hazard ratios for the association of total lifestyle score (0-5 scale) with mortality,” and used available national public databases to estimate life expectancy by levels of the lifestyle score, examining mortality of 42,167 adults. 

They found the females who adopted all five of these low risk factors would at age 50 live 14.0 more years that those who adopted zero of the five; and that men at age 50 who adopted all five would live 12.2 years longer than those who adopted zero. They “estimated that the life expectancy at age 50 years was 29.0 years for women and 25.5 years for men who adopted zero low-risk lifestyle factors. In contrast, for those who adopted all 5 low-risk factors, we projected a life expectancy at age 50 years of 43.1 years for women and 37.6 years for men.” 

With these findings in mind, let’s stop by the American College of Lifestyle Medicine (ACLM), established several years ago as “the professional medical association for those dedicated to the advancement and clinical practice of Lifestyle Medicine as the foundation of a transformed and sustainable healthcare system.” They tell us that “Lifestyle Medicine involves the use of evidence-based lifestyle therapeutic approaches.” 

ACLM and Blue Shield of California have just announced a collaboration “to provide Lifestyle Medicine continuing medical education and other training tools to the nonprofit health plan’s in-network healthcare providers.” They tell us that “with this new collaboration, Blue Shield becomes the first health plan to offer its in-network healthcare professionals access to discounted ACLM courses, membership, conference registration, board certification review coursework and registration for the American Board of Lifestyle Medicine exam.” 

In November last year, ACLM announced the first physicians and health professionals to be board-certified in the field. They also have developed True Health Initiative (THI), “a coalition of world-renowned health experts committed to cutting through the noise and educating on only the evidence-based, time-honored, proven principles about lifestyle as medicine. The ultimate mission of the THI is to eliminate as much as 80% of all lifestyle-related chronic disease through lifestyle as medicine.”


Friday
Feb092018

Employees Feel Their Own Health Plan is Better Than Most Others

Employees Feel Their Own Health Plan is Better Than Most Others
 

By Clive Riddle, February 9, 2018

Surveys have consistently shown over the years that the public generally ranks Congress low in esteem, but their personal Congressman is held in higher regard. Health Plans, like Congress, have been a favorite target as well, but similarly – people tend to like their personal coverage more than how they view health plans overall.

AHIP has just released a 42-page report of findings from their national survey “The Value of Employer Provided Coverage” that not only reinforces this phenomenon – in which respondents rank their own plan higher than their overall view how health care is covered, but also makes the case that consumers place employer provided coverage in higher regard than the nation’s health coverage system as a whole. On top of that, there is perhaps less angst about the nation’s health insurance system overall than one might have thought.

63% were satisfied with the nation's current health insurance system, and 31% were dissatisfied. 71% were satisfied with their own health plan, and 19% were dissatisfied. 60% felt their personal cost was reasonable and 29% felt the cost was unreasonable, while 66% felt the cost was unreasonable for Americans as a whole. 52% described their deductible as reasonable, while 36% said it was unreasonable. However, for those dissatisfied with their plans, 82% cited costs as the main reason.

72% say they are adequately informed about health insurance benefits under their plan, yet only 20% understand that employers average paying above 75% of the total costs.

In other findings from the survey:

·         71% remain concerned the cost of health care will continue to rise

·         56% prioritize comprehensive benefits while 41% prioritize affordability of plans.

·         46%said health insurance was a deciding factor in choosing their current job

·         56% support keeping employer provided coverage tax free, and 13% oppose

·         58% prefer increased market competition while 42% support increased government involvement to address costs

·         Prescription drug coverage (51%), preventive care (47%), and emergency care (47%) rank among the benefits that matter most.

 
Friday
Oct272017

CVS, Aetna, Retail Integrated Delivery Systems and the Strange World of Frenemies

by Clive Riddle, October 27, 2017

As widely reported, including in the Wall Street Journal, CVS is making a very serious bid to acquire Aetna for more than $200 a share, equating to $66 billion. The most often cited drivers behind this deal include:

  • CVS’s strategic response to Amazon’s potential entry into the pharmacy business
  • CVS strategic response seeking growth outside core business, after antitrust regulators rejected Walgreens/Rite Aid merger
  • Aetna strategic response seeking growth outside core business after antitrust regulators rejected Aetna/Human and Anthem/Cigna mergers
  • Aetna would serve as significant source of members for CVS PBM division, customers for CVS pharmacies and patients for Minute Clinics
  • CVS and Aetna’s strategic response to competitors aligning health plans and PBMs such as UnitedHealth acquisition of Catamaran

Much attention has been given to initiatives for integrated delivery systems between hospitals and medical groups that take on purchaser functions. Does this signal a different focus – on retail integrated instead of clinically integrated systems - bringing together pharmacies, retail clinics, health care coverage, wellness services, patient engagement and care coordination?

But Wall Street experts remind us that doesn’t mean this deal is a sure thing.  Things could fall apart simply due to details in the financial terms, or because of new changes in direction by competitors or in the overall market. The Street quotes Jeremy Bryan, a portfolio manager at Gradient Investments, a minor CVS shareholder: "There's just no case study for this. There could be regulatory hurdles. But we have cautious optimism." The Wall Street Journal states “The deal almost surely would attract close scrutiny from U.S. antitrust enforcers who have expressed concern about health-care consolidation.”

Assuming however there is a clear path forward for CVS and Aetna, the question remains for them what lies in wait for them down the road? A few potential concerns include:

  • Would the deal jeopardize the recently announced Anthem/CVS relationship whereby CVS will service Anthem’s new PBM?
  • Would the deal drive other competing health plans away from the CVS PBM and pharmacies?
  • What if CVS is counting on Aetna becoming a more significant force in Medicare Advantage to drive CVS PDP business, and Aetna fails to deliver?
  • What if the Trump Administration and Republican Congress succeed in further scaling back Medicaid, causing Aetna’s significant investment in Medicaid business to erode and become a drag on CVS overall performance?
  • What if Aetna focuses its pharmacy and retail clinic network offerings on CVS locations, and loses market share to competitor plans with broader offerings?

On the other hand, maybe the deal wouldn’t cause competitors to blow up relationships with CVS or Aetna. The Washington Post quotes Adam Fein, president of Pembroke Consulting: “This is part of the strange world of the health insurance and PBM industry. Many companies are frenemies.”

Friday
Sep222017

NCQA Releases 2017-2018 Health Plan Ratings

NCQA Releases 2017-2018 Health Plan Ratings
 

By Clive Riddle, September 22, 2017


The National Committee for Quality Assurance (NCQA) has just released its 2017-2018 Health Insurance Plan Ratings. NCQA reports that they evaluated 1,429 health plans and rated 1,062: 498 private (commercial), 386 Medicare and 178 Medicaid.


NCQA’s ratings are based on a scale of 1.0 to 5.0, and they state their system is similar to the CMS Star Rating approach for Medicare Advantage plans. NCQA tells us that “the overall rating is the weighted average of a plan’s HEDIS and CAHPS measure ratings, plus accreditation standards (if the plan is accredited by NCQA), rounded to the nearest half point. Accreditation standards are given 10 percent of the weight of the valid HEDIS and CAHPS measures that a plan submits. The overall rating is based on performance on dozens of measures of care and is calculated on a 0–5 (5 is highest) scale in half points. Performance includes three subcategories (also scored 0–5 in half points): Consumer Satisfaction, Prevention and Treatment.” If you really want to get into the weeds regarding their methodology, you can click here to review their 16-page methodology report.


NCQA share that the “Top Ten States with the Highest-Rated Health Plans (receiving a 4.5 or 5.0 out of 5 rating) for Three-Year Average:

1.     Massachusetts

2.     Rhode Island

3.     Maine

4.     New Hampshire

5.     Wisconsin

6.     Minnesota

7.     Hawaii

8.     New York

9.     Vermont

10.  Iowa


NCQA also tells us that “high and low performers Are rare: of the 1,062 rated plans, 103 (10%) received a top rating of 4.5 or 5.0 out of 5. Twenty-three (2%) earned the ratings of 1.0 to 2.0.


Digging into their website, we compiled this list of health plans with 5.0 overall ratings for Private, Medicaid or Medicare:


·         BCBS MA (Private)

·         Johns Hopkins US Family MD (Private)

·         Kaiser Northern California (Private)

·         Tufts MA, NH, RI (Private)

·         Jai Medical Systems MD (Medicaid)

·         Group Health Plan MN, WI (Medicare)

·         Gundersen Health Plan IA, WI (Medicare)

·         Kaiser Southern CA (Medicare)

·         Kaiser Northwest OR, WA (Medicare)

·         Kaiser Washington (Medicare)

·         Kaiser Hawaii (Medicare)

·         Medical Associates Health Plan WI (Medicare)

·         Medical Associates Health Plan IL, IA (Medicare)


On the flip side, here’s the plans we identified with ratings of 2.0 or less:


·         Cigna NM  (Private 2.0)

·         Cigna Utah (Private 2.0)

·         Connecticut General NM (Private 2.0)

·         Human Puerto Rico (Private 2.0)

·         Anthem BCBS Nevada (Private 2.0)

·         Triple S Salud PR (Private 1.5)

·         UnitedHealthcare of Texas (Private 1.5)

·         Tokio Marine Pacific Guam (Private 1.0)

·         Union Health Service IL (Private 1.5)

·         Aetna Better Health IL (Medicaid 2.0)

·         Family Health Network IL (Medicaid 2.0)

·         Health Plan of Nevada (Medicaid 2.0)

·         South Florida Community Care Network (Medicaid 2.0)

·         Aetna Better Health NJ (Medicaid 1.5)

·         Community Care Alliance IL (Medicaid 1.5)

·         Cook Children's Health Plan TX (Medicaid 1.5)

·         Affinity NY (Medicare 2.0)

·         Atrio (Medicare 2.0)

·         Community Care Alliance IL (Medicare 2.0)

·         Elderplan NY (Medicare 2.0)

·         Gateway KY, NC, OH (Medicare 2.0)

·         Group Health Inc. NY (Medicare 2.0)

·         Inland Empire CA (Medicare 2.0)

·         Meridian IL (Medicare 2.0)

·         United Healthcare of New York (Medicare 2.0)

·         Virginia Premier (Medicare 2.0)

·         VNS Choice NY (Medicare 2.0)


To be fair to the above plans rated 2.0 and less, there were 367 NCQA evaluated but did not rate due to only partial or no data available – and it is quite possible that a number of these would have received low ratings as well.

 
Tuesday
Sep192017

Need to drive MA plan membership? Don’t ignore your Marketing and Sales strategy

By Ben Kline, Business Development and Joel Andersen, Vice President, Marketing - Lumeris, September 19, 2017

After considerable due diligence, your organization has decided to launch a Medicare Advantage (MA) plan. You evaluated the market and current MA enrollment. You examined market competitors, such as provider-sponsored organizations, regional insurance firms, and large national organizations. You gauged potential competitor responses, trying to figure out if launching a plan would disrupt current market dynamics.

At this point, many organizations begin to shift their attention to enrollment and financial projections. As with any business endeavor, your organization needs to capitalize on its investment and understand where the membership threshold to breakeven lies. The sooner you can reach that membership threshold, of course, the better. However, many organizations fail to realize that the longer you go with low membership, the harder it becomes to garner traction. Meaning, your approach prior to launch and over the first year becomes increasingly important. You only have one chance to enter the market, and when you do, you want to capture your audience—providers, health systems, brokers, and consumers.

Based on our experience, most organizations underestimate, and often ignore, the importance of the sales and marketing strategy for launching a Medicare Advantage (MA) plan. Why? Some organizations that already manage insurance products in other lines of business may believe that traditional sales tactics will be sufficient for an MA launch. Others might think insurance marketing is purely an actuarial exercise and rely on the price point to drive membership.

From our experience in Medicare Advantage, two items are essential for growing membership:

  1. Sales and marketing must be involved, and part of, the strategic planning process. They should be involved in all critical strategic decisions regarding the product launch, including advising on the design of your benefit plans.
  2. A disruptive sales and marketing strategy helps you generate enrollment to ultimately win in your market. Successful plans pinpoint an unmet market need or gap in the market and leverage it—but this requires a highly tailored strategy.

Let’s walk through a common pitfall. In quite a few markets, we see the majority of new MA plans fall into the “me too” trap. They design their plans with a similar benefit structure and provider network to an existing MA product within the market. Their plan may have a slightly lower member cost share, but to the naked eye it appears identical to incumbent plans. To drive plan switching behavior among beneficiaries, you must provide a compelling reason to switch and those reasons must be visible to the consumer.

Many new MA plans also fail to realize that they are not just marketing against other market MA plans, but also against Medicare fee-for-service, Medicare Supplement insurance (Medigap), and standalone Prescription Drug Plans. While identifying competing benefit points is important, addressing the shortfalls of these other coverage options including how your plan addresses those shortfalls is critical. Educating the market on how your MA plan is innovative and transformative (and better than the status quo) can go a long way.

From here, it is critical to design a selling strategy that aligns with your sales channels. The more time you spend with your channel partners, the better. Handing off your new MA product to a series of brokers is not going to be enough. You will likely need to spend time educating your sales channel on Medicare Advantage, and the unique attributes of your plan. Moreover, how you design your product will dictate how you want to sell it. For example, you may have designed your product around a carefully crafted narrow network of providers. Narrow network MA plans call for an entirely different approach, and employment of classic MA sales and marketing approaches will often yield mixed results.

Medicare Advantage provides an attractive opportunity to deliver better care to seniors. To create a competitive advantage, don’t underestimate the power of a disruptive marketing and sales strategy.

Friday
Aug252017

Fighting Over Who The Healthcare Punching Bag Should Be: Health Plans vs. Pharma

By Clive Riddle, August 25, 2017

Earlier this month the Doctor-Patient Rights Project released Not What the Doctor Ordered: Barriers to Healthcare Access for Patients an eighteen page report presenting consumer survey results regarding health insurance coverage denials. The Project issued statements in conjunction with the report including from Stacey Worthy, Executive Director of Aimed Alliance and one of the Project’s founding members, who said “our research reveals a hidden healthcare crisis. The current debate about healthcare reform has focused on getting more Americans covered. Yet, the real crisis is among patients with chronic illnesses who tell us that insurance is worthless when their insurance providers withhold coverage of essential treatments prescribed by a doctor.”

The Project highlighted that the survey found:

  • Insurance plans denied treatment coverage 24% of patients with a chronic or persistent illness or condition
  • 41% of these patients denied coverage were denied once, while 59% were denied multiple times.
  • 55% of those denied treatment said they were denied a prescription medication
  • 41% of those denied treatment said they were denied a diagnostic or screening test
  • 24% of those denied treatment said they were denied a medical procedure
  • 53% of those denied coverage for a treatment of a chronic or persistent illness appealed the denial
  • 49% of those appeals were ultimately successful
  • 70% of the denied treatments for chronic or persistent illnesses were for conditions described as “serious
  • 43% were for treatment of patients described as “in poor health”
  • 29% of patients initially denied coverage reported that their condition worsened
  • 34% denied coverage had to put off or forego treatment altogether

What isn’t clear at all in the report, is what the overall denial rate was for the 1,500 consumers surveyed. One wonders why that information wasn’t shared. The report focuses on denials for those responding that they had a chronic or persistent medical illness or condition, or on types of denials for the overall population surveyed.

The report tells us that 55% of the denials were for prescriptions, with 37% of these for formulary exclusions, while 12% required prior authorization, 9% required step therapy and 5% involved therapeutic substitutions. It becomes less clear from the report what portion of these denials still resulted in an alternative covered prescription, or ultimate coverage of the requested prescription after qualifying conditions were met.

The health insurance industry counters that runaway prescription costs are what we should be focusing on. The Blue Cross Blue Shield Association, AHIP and others have regularly produced reports highlighting the prescription cost problem. AHIP, for example one month ago posted Myth vs. Fact: What’s Behind Drug Prices on their website, in which AHIP goes about “fact-checking some of the pharmaceutical industry’s main arguments for why they have to charge hundreds of thousands of dollars for a course of treatment.” They cite reports and articles to support statements including: “High prices have little or nothing to do with drugs’ innovation or efficacy for patients”; “Pricing is based on what already exists, and competitors use shadow pricing to drive each other’s prices higher”; and “Instead of promoting true medical advances, a common business strategy in the pharmaceutical sector is to buy the rights to older drugs and then immediately jack up the prices.”

Morning Consult wrote about the dustup between the two sides this week, stating that health insurers are “alleging it [the Project Report] is part of a campaign by the pharmaceutical industry to distract the public from rising drug prices,” and that “Insurers say the coalition [Project] is tied to pharmaceutical companies.” The article quotes AHIP: “Big Pharma initiated another long-rumored political ad campaign in its attempts to distract from skyrocketing drug pricing, AHIP spokeswoman Cathryn Donaldson said in an email Monday, adding that instead of spending money on advertising campaigns, pharmaceutical companies should address high prescription drug prices.”

The article also quotes the other side punching back: “PhRMA spokeswoman Holly Campbell said pharma companies spend 20 percent of their revenue on research and development, fueling economic growth and bringing patients new treatments. In contrast, the insurance industry invested $0 in R&D and instead spend nearly 20 percent of premium dollars on administrative costs, she said in a Monday statement.”

Friday
Aug182017

Medicare Advantage plans are rethinking member experience

Kristin Rodriguez, Health Plan Alliance. August 18, 2017

One of my favorite moments during our Medicare Advantage Value Visit, July 19-21 was when Melissa Smith, Vice President, Stars & Quality Innovations with Gorman Health Group said the highest performing health plans are the ones “making old school new again.” The point she was making? That which sets high performing health plans apart is the ability to execute at the member level.  The flavor of how health plans are tackling that member-level execution differed with each case study we explored during our time together last month, and yet the same theme presented again and again, with every conversation.  Elevating and protecting the member experience is paramount to ensuring strong market position, better outcomes and higher star ratings.

The “member experience” is a relatively new, hot topic for MA plans, though really it’s just a consolidation of the efforts we’ve been making for a long time, reframed into a global strategy that is bringing leaders from across the enterprise together to tackle challenging issues like these: making member facing materials more palatable, leveraging digital channels to enhance engagement, evaluating our MA portfolio with an eye on social determinants of health and guarding against chronic loneliness, building dashboards our provider partners actually care about, so they can deliver the care to those members that need it most, and, finally, ensuring appropriate payment so that we can finance that care.


The challenge facing all Alliance member health plans and our provider partners as we seek to “execute at the member level” are the barriers we and our members face, which have traditionally been outside any health plan’s influence or control.  With the industry transformation to value based purchasing and the steady march of quality ratings programs’ focus to outcomes and experience, health plans must drive care from the clinic to the community, and forge partnerships that empower care for the “whole person.”  Our MA members face crippling chronic conditions like depression and diabetes, not to mention persistent loneliness.  And even for our healthy senior population, ensuring a benefit mix that supports long term health and happiness can be challenging when it comes time to submit a bid that both differentiates your plan and is sustainable.

Experts like John Gorman agree that Medicare Advantage is a sound investment for health plans, with strong market growth providing solid opportunity for health plans looking to diversify and perhaps stabilize their portfolio.  To become a high performing MA health plan, however, organizations must be willing to identify and remove barriers preventing them from executing at the member level.  No matter what’s potentially holding you back, you can bet another Alliance member health plan is facing a similar challenge, or perhaps has even found a way to solve it. Through ongoing networking in-person and virtually, and by sharing our tools and lessons learned, we can help one another make “old school new again.”

Friday
Aug042017

More on Medicaid Satisfaction: J.D. Power finds Medicaid Members More Satisfied Than Commercial Plan Members

More on Medicaid Satisfaction: J.D. Power finds Medicaid Members More Satisfied Than Commercial Plan Members
 

by Clive Riddle, August 4, 2017

Recently, we  posted about The July 10 , 2017 Research Letter published in JAMA, A National Survey of Medicaid Beneficiaries’ Expenses and Satisfaction With Health Care, which found that “Medicaid enrollees gave their overall health care an average rating of 7.9 on a 0 to 10 scale. Forty-six percent gave their Medicaid coverage a score of 9 or 10, while only 7.6% gave scores under 5.” We noted these relatively high satisfaction levels occur despite a study published in the May 2017 Health Affairs: Outpatient Office Wait Times And Quality Of Care For Medicaid Patients which found Medicaid patients were 20 percent more likely than others to wait 20 minutes or longer. We also noted Medicaid managed care satisfaction rates were also measured last summer, under a survey commissioned by AHIP, which found 87 percent were satisfied with their Medicaid coverage and benefits.

This week J.D. Power published a 2017 Managed Medicaid Special Report, which concludes that “Medicaid recipients are more satisfied with their coverage than traditional, commercial health plan members.” Their study measured “overall satisfaction with managed Medicaid organizations based on six factors (in order of importance): provider choice; coverage and benefits; customer service; cost; information and communication; and claims processing. Satisfaction is calculated on a 1,000-point scale.”

The study found that:

·           Overall managed Medicaid satisfaction averaged a 784 score

·           The Medicaid average score was 78 points higher than the commercial health plan score for 2017

·           Medicaid enrollees indicate provider choice as the most important factor of overall member experience

·           In contrast, commercial members list coverage and benefits as the key driver of satisfaction

·           42% of Medicaid managed care members deferred medical treatments due to cost

·           40% of Medicaid managed care members avoided buying prescription medications due to cost

Given that Medicaid is administered and differs at the state level, the study addressed state differences, and reports that “Medicaid recipients in states where a dominant regional plan or a plan that owns a health system have the easiest access to doctors and hospitals, underscoring the importance of building robust networks and focusing on coordination of care between providers. Iowa, Tennessee, Arizona and Indiana have the easiest access to doctors and hospitals, compared with the other states included in the study.”

The report also share that “the states with the highest levels of satisfaction among Medicaid recipients are Utah (885), Iowa (859), Colorado (854), Arizona (840) and Virginia (840). The lowest-performing states in terms of overall recipient satisfaction are Kansas (683), Mississippi (686), Delaware (716), New Jersey (728) and California (731).”

 
Friday
Jun022017

Nine Things to Know About J.D. Powers 2017 Member Health Plan Study Results

By Clive Riddle, June 2, 2017


J.D. Powers has just released their 2017 Member Health Plan Study Results. J.D. Powers tells us this 11th annual study “measures satisfaction among members of 168 health plans in 22 regions throughout the United States by examining six key factors: coverage and benefits; provider network; communication; claims processing; premiums; and customer service. The study also touches on several other key aspects of the experience including plan enrollment and member engagement.” The study is based on responses from 33,624 commercial health plan members and was fielded in January-March 2017.


The study assigns scores to each plan based on the above criteria based upon a possible 1,000 point scale. Here are nine things to know about their findings:

 1.     J.D. Powers found that “Integrated delivery systems dominate rankings: Health plans that utilize an integrated delivery system (IDS)—a network of healthcare and health insurance organizations presented to members as a single delivery organization—outperform traditional health plans on every factor measured in the study.”

 2.       Even though narrow networks have often been presented negatively in the media, the study found otherwise: “Regardless of product choice, members who were presented with lower-cost narrow network options were significantly more satisfied with their health plan versus those who were not offered such an option or did not know whether it was offered. However, just 33% of respondents say they were offered a narrow network option.”

 3.       J.D. Powers found that “the effect of payer-provider alliances is mixed: Aetna, Cigna, Anthem, and many other providers have begun to offer commercial products in collaboration with specific providers in the past few years.”

 4.       Satisfaction is highest among health plan members in the five regions: Maryland (723); East South Central (722); California (716); Michigan (716); and Ohio (714).

 5.       Satisfaction is lowest among members in the Colorado (676) and Northeast (682) regions.

 6.       The highest score achieved by any major plan was 794 (Kaiser in Maryland.)

 7.       Kaiser by far had the most regional top scores for major health plans with six: (California, Colorado, Maryland, Northwest, South Atlantic, Virginia)

 8.       The lowest score achieved by any major plan was a tie between Coventry (Aetna) in the Heartland region, and Blue Cross Blue Shield Montana in the Mountain region, both with 653. Given the regional average in the Mountain region (706) was higher than in the Heartland (693), the tiebreaker for Bottom performer would go to BCBS Montana.

 9.       UnitedHealthcare and subsidiaries by far had the most bottom regional bottom scores for major health plans with thirteen:  (Colorado, Delaware/WV/DC, East South Central, Florida, Maryland, Michigan, New Jersey, New York, Northwest, Ohio, Pennsylvania, Southwest, Virginia)


Here are the top and bottom performers of major health plans for each of J.D. Powers 22 defined regions with their respective scores, along with the average score for the region:


California

Top: Kaiser 780

Average: 716

Bottom: Aetna 683


Colorado

Top: Kaiser 725

Average: 676

Bottom: United 661


Delaware/WV/DC

Top: Highmark 712

Average: 691

Bottom: United 666


East South Central (AL, KY, LA, MS, TN)

Top: BCBS Tennessee 735

Average: 722

Bottom: United 684


Florida

Top: AvMed 733

Average: 702

Bottom: United 694


Heartland (AR, IA, KS, MO, NE, OK)

Top: Wellmark BCBS Iowa 723

Average: 693

Bottom: Coventry (Aetna) 653


Illinois-Indiana

Top: Health Alliance Medical Plans 723

Average: 708

Bottom: Coventry (Aetna) 666


Maryland

Top: Kaiser 794

Average: 723

Bottom: United 693


Massachusetts

Top: BCBSMass 707

Average: 703

Bottom: Cigna 664


Michigan

Top: Health Alliance Plan of Michigan 750

Average: 716

Bottom: United 672


Minnesota-Wisconsin

Top: Unity Health Plans 737

Average: 695

Bottom: Cigna 679


Mountain (ID, MT, UT, WY)

Top: SelectHealth 727

Average: 706

Bottom: BCBS Montana 653


New Jersey

Top: Horizon BCBS 712

Average: 705

Bottom: United 693


New York

Top: Capital District Physicians Health Plan 755

Average: 702

Bottom: Oxford (United) 658


Northeast (CT, ME, NH, RI, VT)

Top: BCBS Vermont 725

Average: 682

Bottom: Harvard Pilgrim 666


Northwest (OR, WA)

Top: Kaiser 751

Average: 697

Bottom: United 644


Ohio

Top: Medical Mutual of Ohio 720

Average: 714

Bottom: United 695


Pennsylvania

Top: UPMC 739

Average: 702

Bottom: United 672


South Atlantic (GA, NC, SC)

Top: Kaiser 791

Average: 707

Bottom: Aetna 696


Southwest (AZ, NV, NM)

Top: BCBS AZ 704

Average: 693

Bottom: Health Plan of NV (United) 661


Texas

Top: NA

Average: 710

Bottom: Aetna 686


Virginia

Top: Kaiser 769

Average: 702

Bottom: United 699

Monday
Apr242017

6 Ways to Improve Your Member Communications

Untitled 1
 

 By Claire Thayer, April 24, 2017

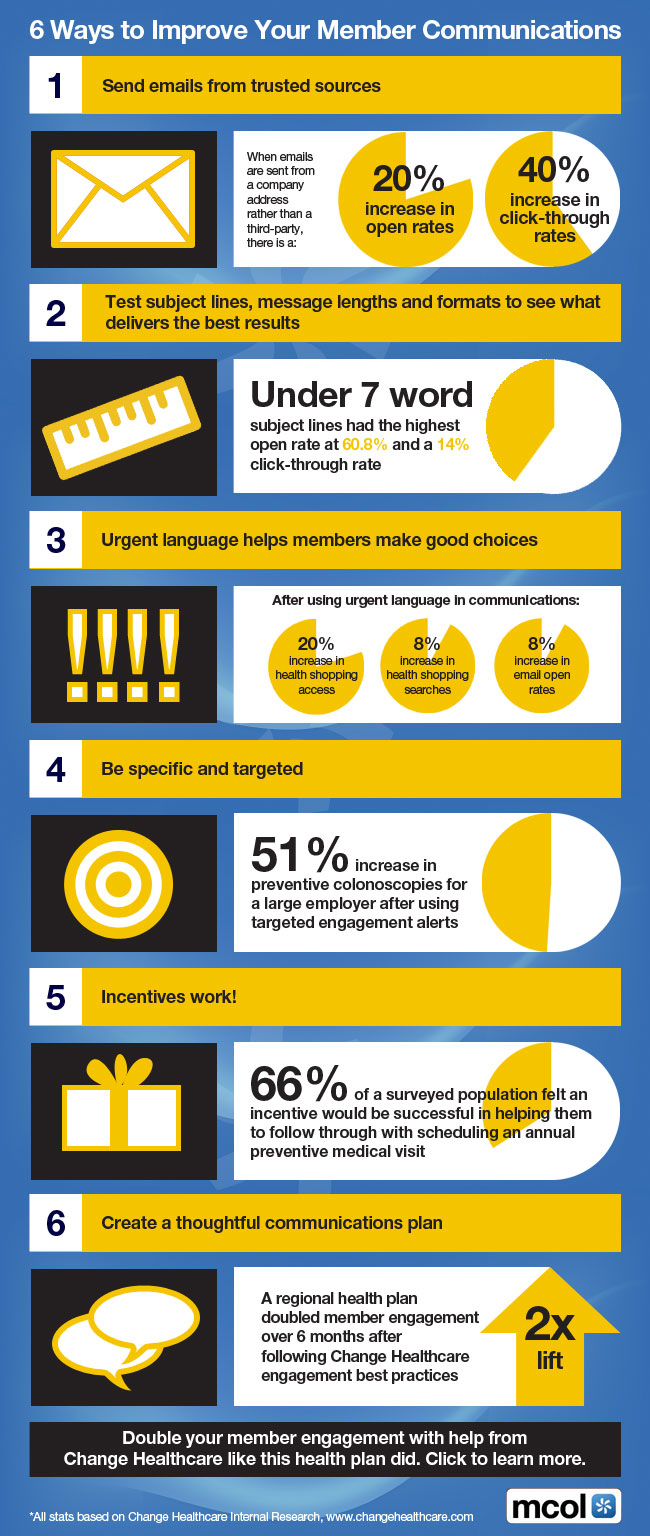
Change Healthcare doubled member engagement for a regional health plan after introducing engagement best practices with a marketing mix that included email, blog posts, social media, a direct mail campaign, presentations to key group leaders and on-site workshops.

This special edition of the MCOL Infographic, co-sponsored by Change Healthcare, identifies 6 effective ways for health plans to improve communications with members:

 (Click to Enlarge Image)

(Click to Enlarge Image)


MCOL’s weekly infoGraphoid is a benefit for MCOL Basic members and released each Wednesday as part of the MCOL Daily Factoid e-newsletter distribution service – find out more here.