Search

Entries in Benefits & Premiums (37)

Thursday
Feb092012

Just Say No  

By Kim Bellard, February 9, 2012

The recent flap over the recent Obama administration decision to not exempt religious organizations over rules requiring first dollar coverage of birth control leave me either bothered or bemused -- perhaps both. 

The controversy has very little to do with health policy and very much to do with the 2012 elections.  Moreover, it was entirely predictable, and it is amazing that the Administration walked right into what is becoming a big pie in its face.  However, the outrage that Catholic and some other religious leaders are expressing over being required to cover birth control in their health plans ignores one important fact.

It’s not their money.

Employers of all stripes see their health plans as a big expense and as something they have both a right and an obligation to try to manage prudently.  Acting as a prudent financial steward of the money, though, is not the same thing as imposing a particular religious belief.  In this case, the objection is, of course, that birth control is against their religious beliefs, and so should not be something they should pay for.  They’re not saying covering birth control is too expensive for their health plans or that it has adverse health consequences for people who use it.  They don’t even seem to care that the health consequences of not using it can be worse for some people.  They just don’t like it on moral grounds, and don’t want anyone using it.

The trouble is, the health plans are paid for by the employees’ money, not the employers’.  Employee benefits are part of employee compensation.  Employees have a decades-long implicit agreement with employers to receive a portion of their wages in benefits, mainly because they can receive that compensation on a tax-free basis.  But it is no more the employers’ money than, say, the money employees put into their 401k plans.

I wonder how people would be reacting if the religious organizations were saying that their employees couldn’t spend any portion of their own salaries on birth control.  I.e., they couldn’t take their wages and go off to buy birth control.  Not just that they shouldn’t, but that they couldn’t, presumably under threat of losing their job.  Would conservative politicians be rushing to support that kind of dictate?  I don’t think so, or at least I hope not.  People are pretty protective of their ability to spend their own money on the things they want.  So why should employee wages that have been retained by the employer on a pre-tax basis to finance a health plan for those employees not be able to buy medical services and supplies that employees want or need, as long as that spending was legal and medically appropriate – which birth control is.

Let’s try an equivalent thought experiment.  Let’s say the religion in question was Christian Science, and they decided that their “health plan” shouldn’t cover most hospital stays, physician visits, or prescription drugs.  Or a plan offered by an employer whose owner is a Jehovah’s Witness, and accordingly rules out covering blood transfusions in the health plan.  To make the experiment more equivalent, let’s be clear that their restrictions are not on plans offered by either church itself, but by organizations associated with those faiths and which employed many people who were of neither religion.  We probably would look askance at those faith-based exceptions, but would they actually be different in kind?

We could go a step further.  Maybe an employer isn’t satisfied just not covering abortion but also doesn’t want to include any health system or provider who provides birth control, and excludes them from their health plan network.  Maybe another employer doesn’t want any health care provider with any religious affiliation whatsoever, and excludes any such providers.  Or, to take an even more extreme example, maybe an employer doesn’t like the word “north” – for whatever reason -- and refuses to cover services by any provider with “north” in its name.   Where do we draw the line at where an employer’s idiosyncratic beliefs should be allowed to dictate its health plan rules?

One can oppose the birth control rule on other reasons more related to health policy.  You could argue, as I have and as John Cochrane did recently in the Wall Street Journal, that preventive services in general aren’t really insurance, and that covering them – particularly with no cost-sharing – is just dollar trading at best.  You could also argue – again, as I have previously done -- that the tax preference for employer-based coverage distorts the consumer market in health insurance, and inevitably invites the kind of employer tinkering with benefits that has led us to the current birth control mess.  You might also argue that birth control as preventive services stretches that term beyond its intended meaning – i.e., does it prevent disease or maintain health?  All of those are fair game for serious health policy discussions, but those are not what is driving this particular debate.

There are lots of reasons both to dislike the rule and lots of reasons to protest the protests about the rule, but it seems inevitable to me that politics will win the day and the Obama Administration will be forced to backtrack in some way.  And our crazy health system will be incrementally crazier as a result.

Monday
Sep192011

Look Up! The Stars Are Aligning for Prevention and Wellness!

By Cyndy Nayer, September 20, 2011

I’m thinking this evening of the amazing journey we’ve begun together, and I’m thinking about the conversation I had with Dr. Joycelyn Elders, former US Surgeon General, who will open our Annual Meeting and Innovation Summit on Nov 14.  Each of our phone calls is such a delight.  Imagine being able to call the woman who “explained” to Congress how teenagers need more guidance, and to ask her some of the hard questions on national health policy!

I’ve been very lucky in this career of mine.  I’ve been blessed to work with some of the most amazing folks at every turn.  What’s remarkable is that so many of us know the real gold in health care is not the care itself, but in making HEALTH the goal of our endeavors.  What’s exciting now is that many of us “passionate idealists” are working hard to make sure that the improvement in health is the #1 priority, and that health care becomes one of the tools to get there.

Each of us approaches this in different ways.  For instance, Brian Klepper, whom you often read about when you read my writings, is passionately moving the needle on Primary Care Providers, blogging on Health Affairs and causing a ruckus with the RUC (the panel that sets clinician reimbursement rates, the panel that is so very much under-represented by primary care physicians).  Brian’s efforts are getting bolder and growing stronger, and I am an ardent supporter of the efforts to be sure that Primary Care gets equivalent pay that shows their importance in the health engagement and promotion that keeps people well, working, and building healthier, prosperous communities.

Another good friend is Ron Loeppke, MD MPH, whom I’ve know for far too many years to remember.  Ron’s passion is now directed to his new job, as Vice Chairman of the Board, U.S. Preventive Medicine, Inc. (traansparency: I have the honor of serving on the board with Ron and so many of our mutual friends).  Ron is also the past Chair of the American College of Occupational and Environmental Medicine (ACOEM), and has chaired the Health and Productivity section for as long as I can remember.  Recently, Ron wrote an op-ed piece on the need for preventionists, and it’s posted on the ACOEM site.  Ron has been a driving force for linking worksite health to worksite performance, and we’ve had the joy of sharing many conferences, slides and ideas together.  As he says in the article:

The clinical science of preventive medicine focuses on wellness and health promotion and health risk assessment to keep people healthy (primary prevention); and early identification/diagnosis of illness through age/gender/risk appropriate screening and biometric testing (secondary prevention); as well as earlier evidence-based intervention/treatment to deter complications and the disabling impact of conditions (tertiary prevention). The preventive health care movement reaches well beyond the four walls of medical facilities to include workplace health and community health initiatives. 

I quote this as others in the space of value-based designs do not see the ROI of prevention and wellness.  But think about it:  if we can prevent the high cost interventions, if we can build intrinsic desire for health and accountability to save our health, the saved dollars will go far to build healthier communities.  The companies that tell me that they cannot focus on health, that they only want to get the costs down, are doing themselves, their families, and their communities a disservice.  Simply stated, if the company gets 80% or more of its workforce from the geographic community, then there is an 80% chance that the next person coming to get a job will have the same risk factors as the person who just left.  Want more proof?  Google Ron and start reading.

And on the topic of value-based designs, another friend I’ve been very much in contact with lately is Mike Critelli, the former CEO of Pitney Bowes who is now the Chair and CEO of Dossia, which is so very much more than a Personal Health Record.  Under Mike’s direction, Dossia is quickly growing into the family and community health management tool that I have been hoping for, building the capacity of families to “gather” into one record that the head of the family health improvement plan (usually the mom, folks, that’s been my story all along!), can manage.  With the strong support of a very talented group of programmers, community health improvement experts, international IT experts, and more that are too many to name, the group at Dossia is getting grand traction around the country, and I am, of course, delighted to have them on the CHVI board.  We share many strong ideas of accessibility and accountability, and then we work with our different constituencies to influence change as far and as fast as possible.

It’s stunning, isn’t it, that we expect an “engaged, accountable patient,” yet the patient gets no records, has virtually no decision-making authority except how much he/she is willing to spend out of his/her own pocket for care.  Yet, that’s not the accountable consumer we want.  We want a consumer who protects the health of herself, her family, her community.  We know, from research published by another renowned colleague, Dee Edington (of Univ of Michigan fame), that an engaged consumer of health has costs 30% lower than one who is unengaged.  We know that reducing risks from hi to moderate lowers costs 33%–that’s what happens when people are engaged, not entitled and waiting for the system to cure them.

Yes, I’m quite lucky, indeed.  Yes, I’ve used this opportunity to highlight the amazing work of my friends and colleagues AND to link to our upcoming summit, because I’m excited about our mission, and I’m excited that they will all be there with us.

Maybe, too,  as I watch the sun set over the beautiful SW Florida sky this evening, the stars really are aligning.  Perhaps we’ve squeezed as much value out of the delivery system as we can–and remember, most of the dollars, all $2.6 Trillion of them, are focused on the 10-20% of folks who are not so committed to health promotion or prevention.  Maybe now that the economics of health is so very important to understand, the stars are ready to assist.  Perhaps the stars, whose light has to travel so very far to be seen, have finally arrived in sight–and those of us who have spent so very many years promoting health, are finally being seen as well.  Perhaps the focus on outcomes allows all of us to ask the question, “How do we short-circuit the path to achieving these outcomes?”  and we can, finally, all get quiet while the stars’ universe responds, “It’s in the path to health promotion.”

It’s a wonderful night to dream of what could be, to imagine that there is a growing focus on health, outcomes, and healthy communities.  Tonight I’m not going to focus on this paradise’s need for jobs, affordable care, and primary care clinicians.  Tonight I’m going to hope and pray and dream of the US as healthy, prosperous, and job-wealthy.  I believe that’s what the stars are showing us.  If we’ll only look up, they will tell us that nothing is impossible.

Wednesday
Apr272011

Voluntary Benefits: Pet Health Insurance

By Clive Riddle, April 27, 2011

The lack of an Affordable Care Act for Pets hasn’t held back the pet health insurance industry. Voluntary benefits in general enjoy popularity with larger employers, who can offer a discounted perk without paying for it. While the recession bit into sales for pet plans and other voluntary benefits as discretionary income and the number of eligible employees took a dip, the outlook for pet health plans remains strong.

Veterinary Pet Insurance (VPI), the nation's oldest and largest provider of pet health insurance, just issued a statement that during 2010 “the company added nearly 400 large companies and associations to the list of more than 2,200 groups that offer pet insurance as a voluntary employee benefit. The addition of these group accounts made VPI Pet Insurance available at a discount to a record 13 million people for the year.”

Under the voluntary benefit agreements, employees receive a 5% discount on insurance premiums, and many may pay via a payroll deduction.

Deana Single, director of group accounts for VPI tells us "when it comes to health insurance benefits, many companies are having to deliver bad news. These costs are continually increasing for many companies and their employees. Fortunately, VPI Pet Insurance can be added to a company's benefits package at no cost to the business."

VPI listed national firms that added their voluntary benefit in 2010 included: Kohl's Corporation; Morgan Stanley; Hewlett-Packard Company; BMW North America, Inc.; McDonald's Corporation; The Boeing Company; Quiksilver, Inc.; and American Eagle Outfitters, Inc. VPI notes that “at the end of 2010, one out of every five Fortune 500 companies offered VPI Pet Insurance as a voluntary employee benefit.”

Laura Bennett’s Embrace Pet Insurance Blog on Pet Business Trends 2011 cites that national pet insurance “gross written premiums (GWP) reached $290 million in 2009 and are projected to reach $327 million (12% growth) at the end of 2010. The three largest pet insurance companies in the US, Veterinary Pet Insurance, Hartville Group, and Pet Health Inc, together representing 78% of the market, will show modest growth of 5.5% in 2010 compared to 16.5% in 2008. The remaining companies will report growth of 47% in 2010 compared to 82% in 2008.”

Laura predicts that “overall premium growth in 2011 will be pulled in two directions. Two factors will drag down GWP growth: the slower growth of the top three pet insurers as they work to offset a more mature book of business; as well as the inevitable decline in sales and renewals from 30% (and higher) premium increases that are being implemented by some of the younger, faster growing companies.”  Her overall assessment of the pet market? “Pet-related spending in 2011 will show an increase over 2010 levels but not at the robust rates we saw prior to the recession.”

Thus for voluntary pet insurance, and other voluntary benefits, the increased popularity from employers clears one hurdle, but the individual purchase hurdle still remains an obstacle that only an improved economy might fully remedy.

Friday
Dec032010

Let’s Move to the Atlantic Seaboard or North Dakota: State Specific Premium and Deductible Data

by Clive Riddle, December 3, 2010

The Commonwealth Fund has just released a report with state specific premium and deductible trends for the past seven years: State Trends in Premiums and Deductibles, 2003–2009: How Building on the Affordable Care Act Will Help Stem the Tide of Rising Costs and Eroding Benefits.

The talking points the Commonwealth Fund promotes in conjunction with the report: (Premiums increase 41%! Deductibles increase 80%) are a little disingenuous as those percentages cover a seven year period (which they dutifully note) but the average ready typically relates such percentages into annual terms, and headlining the equivalent average annual increase could have been more meaningful.

The Commonwealth Fund’s theme from their report is, as Commonwealth Fund Senior Vice President Cathy Schoen tells us, “private insurance costs have been increasing faster than working family incomes. For more than a decade, families with job-based insurance have been sacrificing wages to hold on to health insurance. The good news is that the Affordable Care Act reforms provide a foundation to improve coverage and slow health care cost growth in the future."

Regardless of what conclusions you draw from the 32 page report, it contains great state specific data on average health plan single and family premiums and deductibles, further broken down by employer size. They also examine premium as a percent of median household income. The report goes on to project future increases, with and without the impact of the Affordable Care Act, thus indicating projected savings from the Act.

The report notes “by 2009, the average employer-sponsored family premium across all states was $13,027, ranging from $14,000 to $14,700 in the six highest states….to $11,000 to $12,000 in the 11 states with the lowest average private-employer family premium costs…. Average family premiums in the highest-premium-cost states were about 23 percent above those of the lowest-cost states….. By 2009, there were 15 states in which the average annual premium for family coverage equaled 20 percent or more of median household income for the under-65 population, compared with just three states in 2003 ….  In 28 states, family premiums relative to incomes averaged 18 percent or more for middle-income, under-65 households.”

The report found that U.S. average deductibles by firm size were:

Small Firm Single Deductible: $    703 in 2003 / $ 1,283 in 2009
Large Firm Single Deductible: $    452 in 2003 / $    822 in 2009
Small Firm Family Deducible: $ 1,575 in 2003 / $ 2,662 in 2009
Large Firm Family Deductible: $   969 in 2003 / $ 1,610 in 2009

Here’s some interesting state-specific data from the report. From an affordability standpoint (premiums as a percent of income) the Atlantic seaboard or North Dakota may be your best bet.

Five Highest Family Premium States

(2009 Data: US Annual Average $13,027)
Massachusetts: $14,723
Wisconsin: $14,656
Vermont: $14,558
Wyoming: $14,319
District of Columbia: $14,222

Five Lowest Family Premium States

(2009 Data: US Annual Average $13,027)
Arkansas: $10,969
Montana: $11,365
Oklahoma: $11,417
North Dakota: $11,590
South Dakota: $11,596

Five Highest States: Avg Premiums as % of Median Household Incomes

(2009 Data: US Annual Average 18.7%)
Mississippi: 24.6%
Texas: 21.9%
Louisiana: 21.6%
New Mexico: 21.5%
North Carolina: 21.2%

Five Lowest States: Avg Premiums as % of Median Household Incomes

(2009 Data: US Annual Average 18.7%)
Connecticut: 14.6%
New Jersey: 14.7%
Maryland: 15.0%
Virginia: 15.0%
North Dakota: 15.5%

Friday
Sep102010

Workers Comp: Medical Benefits Slice of the Pie is now the biggest

by Clive Riddle, September 10, 2010

The National Academy of Social Insurance (NASI) has just released a 112 page report: Workers Compensation Benefits, Coverage and Costs 2008 which provides  comprehensive data on workers' compensation cash and medical payments for the nation and for each state, the District of Columbia, and federal programs.

This year, for this first time ever, the report finds that medical benefit claims exceed cash compensation payouts. Here is a summary data table provided by the NASI:

Figure 1: Workers' Compensation Spending, 2008


Type of Spending

Billions of Dollars

Percent  Change


Total benefits paid

$57.6

4.4


  Medical payments

29.1

8.8


  Cash benefits

28.6

0.3


Employer costs

78.9

-6.7


Amount per $100

of Covered Wages

Per $100 of Payroll

Dollar Change


Benefits paid

$0.97

$0.03


   Medical payments

0.50

0.03


   Cash payments to workers

0.48

-0.01


Employer costs

1.33

-0.11


Source: National Academy of Social Insurance, 2010.


Continual health care inflation, utilization and other medical cost escalators are blamed. John F. Burton, Jr., chair of the report panel tells us: The growth in medical spending may reflect both higher prices for medical care and greater use of services. The increase is the continuation of a long-term trend since 1980, but this is the first year that payments for medical care were more than half of all workers' compensation benefits."

However, one additional factor is probably in play. Given 2008 data would be the first year to reflect the great recession, intuitively one might assume the cash compensation slice of the pie was diminished by a shrunken work force.  So while health care costs are an easy target and typically a deserved scapegoat, the economy would seem an equal explanation for why the pie is being sliced up differently.

Friday
Aug272010

COBRA Costs: The Good News, Bad News and Good News

by Clive Riddle, August 27, 2010

The good news: earlier this summer, PricewaterhouseCoopers, in their Behind the Numbers Medical Cost Trends for 2011 report, had this to say about COBRA costs:  “COBRA costs are expected to return to more normal levels in 2011. COBRA subsidies passed by Congress in 2009 created a 1% upswing in the medical trend. Laid-off workers who continued their healthcare coverage typically incurred medical costs of two to four times higher than those of other workers. In 2010, the combination of higher unemployment and new government subsidies to pay for COBRA coverage led to a significant increase in COBRA coverage. A combination of declining unemployment and expiration of the COBRA subsidies is expected to lead to reduced enrollment in COBRA in 2011.”

The bad news: Aon Consulting has just released results from their 2010 Benefits Survey, which found average monthly COBRA premium costs increases from 2009 for the cheaper HMO policies took an extra annual $360 for single coverage and $960 for family coverage from the unemployed and others who opted for COBRA coverage. Here’s a table we compiled from the Aon survey results:

COBRA Monthly Premiums

2010

2009

% Increase

Total Increase

HMO


Employee Only

$429

$399

7.5%

$30

Employee +1

$879

$783

12.3%

$96

Employee + Children

$872

$844

3.3%

$28

Employee + Family

$1,251

$1,171

6.8%

$80

PPO


Employee Only

$449

$439

2.3%

$10

Employee +1

$925

$903

2.4%

$22

Employee + Children

$875

$909

-3.7%

-$34

Employee + Family

$1,310

$1,275

2.7%

$35

"The increased frequency and duration of COBRA use is creating a significant strain on the program, leading to higher costs. Those who are unemployed, and facing uncertainty about employment prospects and future COBRA availability, are utilizing the program more than we've traditionally seen to treat a variety of conditions prior to potentially losing coverage. This coupled with the high unemployment rate, is placing the COBRA program in a unique and unprecedented position."" John Zern, Aon Consulting’s executive vice president and Health & Benefits Practice director tells us.

The good news: the COBRA premium increased from 2009 to 2010 on a percentage basis were in line with non-COBRA premium increases, even though the population would be considered to be much higher risk.

Thursday
Jun032010

How Brokers See the Recession’s Impact on Employee Benefits

by Clive Riddle, June 4, 2010

Survey data on employee benefit trends and implications surrounding such drivers as the recession typically focus on data from large employers.  Large employers, of course, represent the clientele of the major benefit consulting firms that produce the majority of such studies.

Thus it is interesting to consider perspectives from the broker population, which typically represent smaller and mid-size employers. Colonial Life conducted broker surveys at two large national broker conferences during March and April, regarding the economy’s effects on benefits.

Here’s the results provided by Colonial Life, which indicate expansion of voluntary benefits, increasing employee contributions, and adding HSAs/HRAs are the top strategies:

  • Added voluntary benefits options – 59%
  • Increased employee contributions – 48%
  • Added benefits options – 35%
  • Added a health savings account – 29%
  • Switched carriers – 28%
  • Reduced benefits options – 27%
  • Added a high-deductible health plan option with an health reimbursement account – 26%
  • Increased employer contributions – 10%
  • No change – 9%

In this environment, 80% of the brokers surveyed said voluntary benefits are very important to the overall benefits package they offer business owners. It thus could be beneficial for various stakeholders to do their homework on what existing and emerging products are being offered through the voluntary benefits market, and consider their implications.

Friday
May282010

The Center for Health Value Innovation on Value Based Design

by Clive Riddle, May 27, 2010

This week, Cyndy Nayer, M.A., President, CEO and co-founder of the Center for Health Value Innovation and Michael S. Jacobs R. Ph., Principal and National Clinical Practice Leader, Buck Consultants, LLC  (also a board member at the Center) spoke in the HealthcareWebSummit event Leveraging Health: Current Impact of Value Based Design.

What’s going on with Value Based Design initiatives right now? Glad you asked. While some other elements of health reform have stolen the spotlight during the past few months, VBD continues to move forward as a key solution to its core stakeholders. 

The Center for Health Value Innovation is an educational organization that serves as an information exchange for value-based designs. The Center’s members include health plans, employers, unions, government, pharmaceutical organizations and other stakeholders that represent over 40 million lives. The Center recently published a new book, Leveraging Health, which shares findings from their recent interviews and surveys that identify more than 100 levers that influence consumer and patient behaviors in Value-Based Design, and15 categorized macro-levers.

Definitions of Value Based Design have evolved over time. The Center has this to say about defining VBD: “It’s important to note that value-based designs (VBD) are much more than waived or reduced co-pays for chronic care, particularly medications.  A value-based design uses evidence-based clinical impact merged with financial impact (Health + Economics) to guide the behaviors of populations in managing their health.  VBD can influence choice of care provider, appropriate and persistent treatment, and early risk/prevention/wellness.  All of these have been documented to show a meaningful impact in health status, productivity (safety, disability, unscheduled absences, and more), quality and financial cost trend.”

Nayer and Jacobs expanded on this definition during their presentation, stating:

  • VBD is an engagement tool that engages the employee (consumer) and the employer (plan sponsor) and the provider (clinician)
  • VBD focuses on outcomes:  better performance
  • VBD is driven by data that drives the suite of performance tuners: levers
  • VBD is sustainable and applicable at the small-large employer and at the community level
  • VBD builds the Health-Wealth-Performance Portfolio
  • VBD uses Data to invest in incentives (Design) and services (Delivery) that change behavior for improved health, quality, performance and financial trend (Dividend.)       

They note that EAP and behavioral health are important components of VBD, given that behavioral change is the key to sustaining value. They further advocate that if value is to be built on outcomes, than purchasing must be aligned. Nayer and Jacobs stat that Outcomes-Based Contracting must align incentives between the contracting parties.

After VBD emerged as a mainstream concept and solution, the Great Recession intervened, and Nayer and Jacobs point out the effect of the economy on health behaviors, placing employee/patient compliance, adherence and persistence at risk.

Here’s some of the Center’s survey results they shared, which are incorporated into their book, Leveraging Health. Over 100 companies responded to their survey, representing over 1 million lives:

87% Use incentives (levers) in prevention and wellness, 60% Use levers for chronic care management, and 26% Use levers for guidance to appropriate care delivery

Given that VBD programs provide various forms of incentives, including applicable waivers of cost sharing, an obvious concern in a down economy would be that employers would feel pressure to pull back in these areas to in the name of achieving short term savings. However the survey indicated 79 % of the employers with VBD in place two or more years made no VBD changes in 2009 and 56% did not plan to make changes in 2010.

Of the 44% who did anticipate changes in 2010: 64% of them plan to pass more of the cost of brand drugs to the employee; 16% plan mandatory enrollment in disease management programs; and 16% plan to pass more of the cost of generic drugs to the employee.

Additional survey results:

  • 63 % waive employee cost sharing for yearly screening exam
  • 40 % provide insurance premium incentive for completion of a Health Risk Assessment (HRA)
  • 54 % cover depression under care management program
  • 70 % reduce/waive co-pay for utilizing the lowest cost appropriate site of care (e.g., urgent care, convenient care, onsite services, medical travel)
  • 58 % provide incentives for the use of EAP programs
  • 35 % provide incentives for financial counseling
  • 20% reduced applicable prevention screen cost for age/gender appropriate groups
  • 18% provided an insurance premium incentive for completion of a biometric screen
  • 13% reduced OOP costs for setting and/or achieving health promotion goals
  • 13% provided insurance premium incentive for complying with recommended prevention exam
  • 12% adjust their condition-based formulary (all tiers lowered for specified conditions)
  • 12% link co-pay/coinsurance waivers to mandatory condition management

Employers also indicated these as their top challenges to deploying their VBD programs (more than one answer allowed):

  • 53% - Increasing engagement with employees: slow to use the new benefits
  • 45% - Enrolling employees in disease management programs
  • 42% - Keeping the momentum going
  • 34% - Obtaining and integrating data
  • 34% - Lack of communication with physicians/pharmacists/clinicians
  • 34% - Communicating benefits with the covered lives
  • 32% - Segmenting and interpreting data
  • 18% - Communicating success with the covered lives
  • 13% - C-Suite support
Thursday
Apr012010

Hewitt Says We’re More Engaged in Selecting Our Benefits

by Clive Riddle, April 2, 2010

Hewitt Associates this week released data indicating that employees in 2009 were more engaged in selected their health benefits than in previous years. That being said, Hewitt concluded their choices weren’t all that different than before, they were just more involved in the process.

Here’s some of what Hewitt had to report on the matter: “Hewitt's analysis of 6 million U.S. workers, for whom Hewitt managed benefits enrollment in the fall of 2009, revealed the highest number of active enrollees since Hewitt began tracking the data in 2003. Nearly half (45 percent) of employees actively chose their benefits for 2010 instead of passively defaulting into the same coverage or no coverage at all. This is up significantly from the 2009 open enrollment period, where just 39 percent of employees actively enrolled. Despite employees taking a more active role in selecting their benefits, Hewitt's data shows very few workers enrolled in different health insurance plans.”

So what plans are employees enrolling in? Here’s a data table Hewitt shared indicating enrollment by plan type for the past three years (note that the survey involves large employers):

Enrollment by Plan Type

Open Enrollment Year

EPO

HMO

POS

PPO

Indemnity

HDHP

2008

1%

17%

11%

31%

15%

20%

2009

1%

17%

5%

34%

11%

18%

2010

1%

14%

8%

35%

13%

18%


So what does Hewitt make of all this? Sara Taylor, Hewitt’s Health and Welfare Strategy Leader tells us: "Employee inertia continues to play a large role in enrollment decisions—it's encouraging to see that people are more engaged in assessing their benefits, but that doesn't mean they are necessarily making different choices. If employers want workers to make different elections, they might need to adopt a more aggressive approach—whether it's changing or reducing plan options or offering plans with widely differing price points."

Wednesday
Oct072009

Comparing HDHP, HMO and PPO Value based on Employer Benefit Survey Data

By Clive Riddle, October 7, 2009

The Kaiser/HRET Survey of Employer-Sponsored Health Benefits, 2009 was released a couple of weeks ago.  The annual survey is a must read for any professional interested in employer health benefit issues and is packed with data.

I thought it would be interesting to use the data to compare the value of HDHPs to HMOs and PPOs, realizing of course for any individual’s actual situation, you’d need to compare specific benefit and premium parameters of specific plans. Also, this doesn’t take into consideration if there were any employer contribution to an HRA or HSA account in conjunction with the HDHP, or tax advantaged employee contributions were made to the account. But the survey data can still provide an overall sense of the industry-wide value of each plan type on the basis of premium and deductible comparisons.

Here’s ratios of single premium by plan type, compiled from the survey data.

HMO Premiums 1.011
PPO Premiums   1.020
POS Premiums   1.002
HDHP Premium 0.826
Overall Average 1.000 ($402 per month)

So based on the survey data does the HDHP premium, at 82.6% of the overall average premium, justify itself when the deductible cost sharing is taken into account? Let’s compare, based on single premium and deductible data.

HMOs: The survey data indicates that 84% of HMOs have no deductible requirement, and that those who do have an average of a $699 annual deductible. This yields a weighted average (16% * $699) of a $111.84 deductible for all HMOs. The survey data indicates that the average HDHP deductible is $1,838. Thus the net annual difference in deductibles is $1,726.16.

For simplicity, assuming that the HMO and HDHP copay/coinsurance requirements, benefit limitations and maximums after the deductible is met are in the same ballpark (which of course often isn’t the case) we’ll compare the value of an HMO to HDHPs solely on premium versus deductible differential.

The total annual difference in premiums based on the survey data is $892 ($4,878 annual HMO premium versus $3,986 HDHP premium). If you were to consume the entire HDHP deductible amount, the HMO would save you $834 (the deductible difference of $1,726 less the premium difference of $892.

But another way of looking at it is the HDHP would save you $892 if your total annual health expenditures for the year were less than $111.84 (the average HMO deductible amount.) Assuming an equivalent coinsurance rate of 18% after the deductible is met, meaning that 82 cents of each dollar consumed after $111.84 (the HMO avg deductible) would be reduced from the $892 savings for the HDHP. This means that once you spent an additional $1,087.80 ($892 divided by 82%) the savings stop. This equates to total annual health claims of $1,199.64 ($1,087.80 + the $111.84 avg HMO deductible.)

So you’d have to gamble that your annual health claims would costs less $1,200, or 65% of the HDHP deductible requirement in order for the HDHP to save you any money compared to an HMO.

Traditional PPOs: Using the same methodology, the survey data indicates that 26% of PPOs have no deductible requirement, and those who do have an average $634 deductible, yielding a weighted average $469 deductible for all PPOs, and an annual net difference of $1,368.84 compared to the HDHP deductible. The total annual difference is premiums based on the survey data is $936 (the PPO annual premium is $4,922).

So if you were to consume the entire HDHP premium, the PPO would save you $432.84  ($1,368.84 less $936). The HDHP would save you $936 if your total annual health expenditures for the year were less than $469 (the average PPO deductible amount.) Assuming an equivalent coinsurance rate of 18% after the deductible is met, meaning that 82 cents of each dollar consumed after $469 (the PPO avg deductible) would be reduced from the $936 savings for the HDHP. This means that once you spent an additional $1,141.46 ($936 divided by 82%) the savings stop. This equates to total annual health claims of $1,610.46 ($1141.46 + the $469 avg HMO deductible.)

So you’d have to gamble that your annual health claims would costs less $1,610, or 87.5% of the HDHP deductible requirement in order for the HDHP to save you any money compared to a traditional PPO.

Wednesday
Jul082009

Medicare Drug Coverage and the Impact on Overall Health Care Spending

By Clive Riddle, July 8, 2009

An important paper reporting on results of an NIH funded study : “The Effect of Medicare Part D on Drug and Medical Spending”was posted online last week with the New England Journal of Medicine: [Volume 361:52-61 July 2, 2009 Number 1] and authored by Yuting Zhang, Ph.D., Julie M. Donohue, Ph.D., Judith R. Lave, Ph.D., Gerald O'Donnell, M.S., and Joseph P. Newhouse, Ph.D..

The pharma industry for decades has been a proponent that appropriate prescription coverage can have a positive impact on overall health care costs. Certainly Medicare policy advocates argued the point in the debate leading up to establishment of Medicare Part D prescription coverage earlier this decade. Now that time has passed, the opportunity has arisen to examine the actual data to address this issue.

The study examined over 35,000 Medicare members from Pennsylvania’s Highmark Blue Cross Blue Shield from 2004 through 2007. The study included a control group with employer based retiree drug coverage that did not change after Part D took effect, and had $10 to $20 copayments with no spending limits or coverage gaps. Three groups were also examined that had no or limited drug coverage before Part D, and then enrolled as in Part D plan as of January 2006. One group had no previous drug coverage, and the other two had previous drug benefits with quarterly spending limit caps.

The study found that the cost of introduction of Part D benefits for those with no or very limited prior coverage was approximately offset by savings in overall health care costs, but overall health care spending did increase for those with more generous prior coverage.

In comparison to the control group, after introduction of Part D, the average total monthly drug spending was $41 higher (74% increase) for enrollees with no previous drug coverage, $27 (27% increase) higher among those with a previous $150 quarterly cap, and $13 higher among those with a previous $350 quarterly cap (11% increase.) Furthermore, overall monthly medical expenditures (excluding drugs) were $33 lower in the group with no previous coverage, $46 lower in the group with a previous $150 quarterly cap, but $30 higher in the group with a previous $350 quarterly cap.

The study concluded that “The offsetting reduction in medical spending in the two groups with the most limited previous benefits was probably due to improved medication adherence among enrollees with chronic conditions.” The study also addressed the overall health care cost increase for the group with more generous prior coverage: “Why did medical spending rise in the group with a previous $350 quarterly cap (the most generous previous coverage among the three intervention groups), as compared with the no-cap group? The additional use of prescription drugs in all three groups probably included both overuse of some drugs and underuse of others, but the proportion of the increase that was overuse may have been highest in the group with the most generous previous coverage. Our finding that the use of oral antidiabetic drugs did not change significantly in this group is consistent with this hypothesis.”

The References section at the end of the report is well worth browsing, as links to various prior studies are provided. Beyond the References provided in the report, I found two other studies that proved to be of particular interest while researching this topic:

The AARP Public Policy Institute published “How Prescription Drug Use Affects Health Care Utilization and Spending by Older Americans: A Review of the Literature” by Cindy Parks Thomas, Ph.D., Brandeis University, Schneider Institute for Health Policy, in April 2008. Key conclusions from this 57 page report include: (1) “Prescription drug coverage can produce cost offsets from reductions in non-drug services, such as hospitalizations and emergency visits.”; (2) “Studies that incorporate increased longevity into spending projections suggest that cost offsets may diminish over time.”; and (3) “Strict benefit limits of all kinds decrease prescription drug use and increase use of other medical services, including acute and long-term care services.”

Baoping Shang, and Dana P. Goldman of the RAND Corporation; National Bureau of Economic Research (NBER) published results in 2007 from their study “Prescription Drug Coverage and Elderly Medicare Spending” (with preliminary results published in 2005) that examined Medicare Supplement (Medigap) enrollees with and without prescription coverage. They found that “Medigap prescription drug coverage increases drug spending by $170 or 22%, and reduces Medicare Part A spending by $350 or 13% (in 2000 dollars). Medigap prescription drug coverage reduces Medicare Part B spending, but the estimates are not statistically significant. Overall, a $1 increase in prescription drug spending is associated with a $2.06 reduction in Medicare spending.”

Thursday
May072009

Dual Surge: Ineligible Dependents, and Dependent Eligibility Audits

by Clive Riddle, May 7, 2009

Managed Healthcare Executive Magazine, in its May Issue, quote us in an article by Tracey Walker: “Audit Reviews Keep Costs Down.”

The gist of the article is, that 5% or more of many employer’s covered members involve dependents that do not currently meet their employer’s eligibility criteria, and that eligibility audits are an effective way to reduce employer costs and exposure- directly if they are self-insured, and indirectly if they can improve their experience with their fully insured health plan.. It is noted that in the current economic climate, employer demand for such audits may be on the rise.

Our quote involved regulatory scrutiny of health plan disenrollment of such dependents:

“Employers and health plans do need to be cognizant of regulatory issues as they proceed with dependent eligibility audits. Employers would have ERISA regulatory protections from state regulators, according to Clive Riddle, president and founder of MCOL, a provider of business-to-business managed care resources. ‘But when self-funding is not involved, the health plans covering the dependents flagged in eligibility audits must be cautious in how they handle disenrollment and in particular, rescissions of any claims incurred,’ he says. States such as California have clamped down on rescission activities, and health plans have to follow very strict guidelines in numerous states when dealing with this issue.”

Mercer last month issued a release on this topic: “Mercer sees significant growth in health plan dependent eligibility audits.” Mercer pegs the percentage of ineligible dependents in a range of 3% to 8%, and the average cost of covering a dependent for plan sponsors at $1,900 per year. Thus Mercer calculates a plan sponsor with 10,000 dependents and 5% ineligible could save $950,000 annually through such an audit. It’s certainly easy to see why such audits are increasing in frequency. And of course, due to the impact of the recession with layoffs and unemployment, the number of potentially ineligible dependents continue to rise.

From a public policy standpoint, a surge in employers and health plans dropping coverage of greater numbers of dependents will of course only swell the ranks of the uninsured. One policy solution would be to mandate dependent eligibility be tied to IRS dependent status, at least up to a defined age, as opposed to the current patchwork of employer, plan and state specific criteria, which typically would disallow a 22 year old just graduated college student living at home with their parents while looking for a job.

Friday
Nov212008

What can we deduce about Deductibles?

By Clive Riddle

Mercer’s Study finds the median individual deductible jumps to $1,000

Mercer just released results from their 2008 National Survey of Employer-Sponsored Health Plans, with headlines declaring “$1,000 health plan deductible was the norm in 2008.” And this was just for traditional PPO plans, not counting consumer driven high deductible health plans. And this was the median figure, not the mean which is more susceptible to skewing upwards given the wide range of benefit design out there. And this was for individual, not family coverage.

Certainly the ongoing increase of consumer cost sharing built into plan design, and the growth in consumer driven high deductible health plans that has paved the way for the trend and acceptance in higher deductibles in traditional PPO plans as well. As Blaine Bos, of Mercer tell us, “The introduction of the HSA may have changed employers’ thinking on just how high a deductible can go without causing employees to revolt. Raising the deductible has become the fallback for employers faced with cost increases they can’t handle. It’s the easiest way to reduce cost without taking more out of every employee’s paycheck.”

But not so fast, there’s a little more to the deductible story than just $1,000 individual deductibles. Deductible amounts are quite different for small versus large employers. Mercer found the median deductible for large employers is just $300. Other surveys have borne this out as well. The Kaiser Family Foundatio/HRET Employer Health Benefits Annual Survey yielded lower deductible amounts for traditional PPOs, but with the same separation by size: a mean of $560 overall, but $917 for small employers and $413 for large employers.

It also shouldn’t be glossed over that the KFF/HRET study found the mean deductible at $560, a far cry from $1,000. Too bad KFF didn’t share what the median was, but they report the following distribution: 52% under $500; 30% $500 to $999; 13% $1,000-1,999; and 4% $2,000+.

The trend for first dollar coverage of wellness and certain value-based benefits should be noted as well. While deductibles are rising fast, more employers are adopting plans designs with first dollar coverage for specific wellness and "value based" items. This at least make a larger deductible a little more palatable, and allows plan design to influence desired objectives.

Tuesday
Nov042008

Medicare Prescription Drug Coverage in a Big Box

By Clive Riddle

Retail health care will continue to emerge and develop in new arenas. Retail health care started with prescription drugs decades ago, and now retail, convenient care clinics have been the rage. But there are certainly more retail avenues to develop, starting with health insurance at the individual level. Marrying individual Medicare distribution with prescription drugs at the retail would seem a natural. At least it has to Aetna and Costco.

This week, Aetna and Costco announced an alliance to offer a Medicare Part D Prescription Drug Plan: the Aetna Medicare Rx - Costco Plus Plan, to be available in 17 states, with Costco providing sales distribution to its members, and preferred Rx benefits provided for prescriptions filled at Costco pharmacies.

The plan will be available in Alaska, Arizona, California, Colorado, Florida, Hawaii, Idaho, Illinois, Michigan, Nevada, New Mexico, New York, Ohio, Oregon, Utah, Virginia and Washington. Monthly premiums will range from $50 to $70, depending upon the state. Under the plan generic copays, typically $10 at other pharmacies, will be $5 at Costco, or in some cases, zero copay.

Costco operates 545 “membership warehouses”, including 400 in the United States, and also operates Costco Online, an electronic commerce Web site at costco.com.

Wednesday
Oct082008

Getting to the bottom of Counter-Intuitive Data

By Clive Riddle

The KFF/HRET Annual Survey of Employer Sponsored Benefits and Smaller versus Larger Group Premium Costs

Results were recently released from The Kaiser Family Foundation and Health Research & Educational Trust  Annual Survey of Employer Sponsored Benefits. This year’s 214 page document is a must read if you want a statistical photo album, as opposed to a snapshot, of employer health benefits landscape.

While the KFF/HRET is rightfully one of the most often cited, and leading sources for employer health benefit statistics, the results occasionally contain data that seems counter-intuitive.  Digging through this year’s document, the comparison of  smaller versus larger employer group premium costs raises such a red flag.

Intuition would guide us to believe that larger employer groups would experience lower premium costs and lower premium increases. Historically, a wide number of studies from national benefit consulting firms have borne this out.

But the 2008 KFF/HRET survey tells us that premiums are now cheaper for smaller firms (3-199 workers) compared to larger firms (200+ workers), with the average monthly single premium at $382 for smaller versus $397 for larger firms (3.9% higher), and the average monthly family premium at $1,008 for smaller versus $1,081 for larger firms (7.2% higher.) The report notes that in past years, any differential was not so significant.

What gives? It of course is always tempting in such situations to dismiss the information as a result of skewed data and a faulty survey. But who are we to know that this is case? Instead, the answers may still be in front of us. The report doesn’t specifically respond with answers to this vexing question, but it does supply enough detailed data to offer some explanations, if you dig one level deeper.

And in digging, it would appear that the difference could be due to benefit packages, plan funding, and demographics.

When broken down by plan of benefits, smaller firm premiums are actually more expensive for a number of categories (Family HMO, Single PPO, Single and Family HDHP) and the differential is not as pronounced where larger firms are more expense (3.2% higher for Single HMO and 2.4% higher for Family PPO) except for POS premiums, which don’t have that significant of enrollment.

Thus part of the explanation for less expensive smaller firm premiums could simply be in the mix of benefit packages (HMO vs PPO vs HDHP etc) for smaller firms vs larger firms. On top of that, a good portion of the explanation could be in the level of cost sharing, which impacts premium costs. For example, the average Single PPO deductible for smaller firms was $917, compared to $413 for larger firms.

Another component of the explanation may be in that self-funded plan costs are running higher than fully funded plans. The report indicates that family self-funded premiums average 6.2% higher than fully funded premiums. The report also tells as that only 12% of smaller firms have some level of self-funding compared to 77% of larger firms. Furthermore, more large firms are trending towards self funding. 62% of workers with employers having 5,000+ employees self-funded in 1999, increasing to 89% in 2008, and 62% of workers with employers having 1,000 to 4,999 employees self-funded in 1999 compared to 76% in 2008.

Lastly, demographics can provide some of the explanation. Larger groups tend to have a slightly older population, and the report indicates that firms with less than 35% of workers aged 26 or under had 6.7% higher premium costs than firms with more than 35% of workers aged 56 and under. Larger groups tend to have workers with higher wage levels, and the report indicates that firms with less than 35% of workers earning $22,000 or less had 8.3% higher premium costs than firms with more than 35% of workers earning $22,000 or less. Lastly, larger firms tend to be more unionized, and the report indicates that firms with at least some union employees had 4.3% higher premiums than firms with no union employees.

The point of all this digging is to demonstrate, when considering reports as valuable of the KFF/HRET annual survey, not to just browse through the summary and walk away with a headline that smaller groups now have lower premiums than larger groups, as some news organizations have done, or to dismiss the survey as flawed, as some pundits have done. Digging through the data can yield explanations, which would seem to indicate that on an apples-to-apples basis, small groups aren’t really cheaper. Instead, small groups have higher cost sharing, a different mix of benefit plans, less self funding and demographics that make them “apples” compared to large firm “oranges”, and the apples do cost less than oranges in this case.

Tuesday
Oct302007

Benefits Cycle

Benefits Cycle

Mercer, the national human resources and benefits consulting firm, in their annual employer health plan sponsor survey findings, recently projected that the average total cost to renew health plans for 2008 with no changes would yield a 9% increase, but actual increases for 2008 are projected at 6.7% dues to changing plans, adding lower-cost options or by altering benefit design. (see “After a three-year lull, health benefit cost growth picks up a little speed in 2008”, Mercer Press Release, September 5 2007,
http://www.mercer.com/pressrelease/details.jhtml/dynamic/idContent/1279545

Thus what health plan premium rate an employer winds up with from year to year is a result of negotiations and changes in the plan design.

Earlier this month, The Wall Street Journal ran an article by M.P. McQueen, “New Health Plans Tout Predictable Premiums” (see Wall Street Jouranl, October 9, 2007; Page D3; http://online.wsj.com/article/SB119188282779652669.html - subscription required)

The article cites an example of Guardian Life offering muti-year premium rate contracts and guarantees, that build-in the ability for Guardian to alter cost-sharing provisions if actual costs for the group exceed specified thresholds. The article also cites multi-year rates from Humana, based upon other requirements.

Multi-year rate guarantees are a sign that premium rate competition may be heightening, which is of course is addressed in the concept of the Underwriting, or Premium Rate pricing cycle.

The pricing cycle phenomena has existed for more than four decades. Under the cycle, during profitable periods for health plans, the plans desire to expand or protect market share and intensify price competition. Competing plans keep pace, triggering mini price-wars and multi-year contracts. Depressed pricing in turn triggers unprofitability, which ultimately escalates to the point where market leaders accelerate their price increases. Other plans follow suit, and soon escalating industry wide increases bring the sector back to profitability and the cycle begings anew.

They cycle has softened during this decade, as plans have grown less competitive due to product and market consolidation, and changes in plan behavior. This softening of competitive behavior, combined with the advent of consumerism and cost sharing, brings us to the concept of a benefits cycle.

Under a benefits cycle, benefit coverage and cost sharing can fluctuate based on plan competition for consumer enrollment during profitable and unprofitable points in the cycle. Guardian Life’s strategy would seem a step in that direction.

Tuesday
Jul032007

The Relationship Between Premium Increases and Reform

The Relationship Between Premium Increases and Reform

Never mind that PriceWaterhouseCoopers recently issued a study indicating the medical costs increases that health plans bear will further decelerate for 2008. Hewitt Associates just issued projections that initial premium increases quoted by the plans to employers will spike upwards for 2008. If indeed premiums increases reverse the trend of the past four years and accelerate again, such movement will in turn accelerate reform initiatives and market changes.

Lets take a step back and look at the premium pricing and underwriting cycle. Under this historical model, plans are driven by cyclical market share and premium price competitive behavior. There are periods where premium increases are significant, then decline, and then rapidly increase again. Here’s how the cycle works:

  • During profitable periods: a) plans want to expand market share; b) they start to lower price to do so; c) other plans match lower prices to keep pace and not lose share; d) price wars similar to airline fare wars erupt and multi year contracts develop.
  • Then a downswing develops: a) due to insulation of provider contract capitation and discounts and the time lag on fee for service claims, considerable time elapses before financial pressures are fully visible from the lowered premiums; b) due to multi-year contracts and price pressures nothing much can be done about the problem as it becomes apparent.
  • A period of significant losses then occurs: finally enough of the market is losing money so that several major players break rank and begin increasing rates and everyone else follows suite.
  • Finally there is a return to profits: the premium increases continue until profits are being generated, and the cycle begins anew.

However, with the new century, health plan economic behavior appears to have changed to some degree:

  • Plans are now somewhat less driven by long-term market share
  • Plans are now somewhat more driven by short-term bottom line profitability
  • Plans are more willing to exit unprofitable markets and product lines
  • Plan consolidation has occurred due to closures of failing plans, market exits and acquisition of plans.
  • Premium competition has somewhat diminished because of all the above.

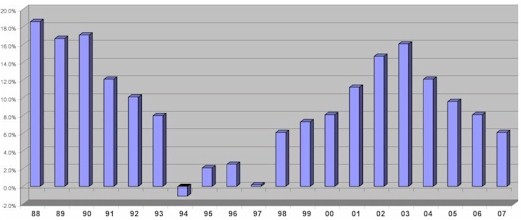
This doesn’t mean that the premium pricing cycle has disappeared. It does mean the down part of the cycle will be less pronounced due to reduced premium competition. Here’s how the cycle looks graphically:

premiumjpg.jpg

Source: MCOL Managed Care Fact Sheets

Now let's correspond a little history of some major reform and market movements in the past twenty years to this premium increase graph. You will notice each of these major market movements correspond with shifts in the premium trends:

  1. PPO marketshare diminished, and HMOs became the mainstream employer health plan option in the late 1980s as the vehicle to address double digit rate increases nearing 20%
  2. HMO tight utilization controls, provider capitation arrangements and deeper discounted contracts rapidly increased in scope as HMOs gained marketshare clout in the first half of the 1990s, and health plans required cost savings to counter significant premium price competition. Pressure for health care reform erodes after 1993 as premium increases rapidly delerate.
  3. Significant Managed care backlash emerged from providers, media and consumers in the late 1990s, causing a relaxation of utilization controls, a very large reduction of capitation programs and reduction of provider discounts. PPO enrollment again accelerated due to the backlash, and premium increased as resulting costs increased.
  4. Consumer driven health plans and greater consumer cost sharing emerged with the new decade as cost increases reached double digit levels. the number of uninsured reach peak levels and pressures for reform increase.

So now plot the next points on the graphs fro 2008 - 2010. Will they continue downward or climb back upward. If they continue to decelerate, we would predict diminished enthusiasm for significant health care reform, and for movement to consumer driven plans. If they start accelerating, a fire should be lit under greater pressures for reform, as well as consumer driven programs. Of course, the reform movement and consumer driven movement will most likely be at odds in the direction they intend to take us, but momentum they may both well have in that scenario.

So the question is, what happens next? Will health plans keep decelerating their premium increases, as the PwC medical cost study would cause us to believe, or will premium increases accelerate, as the Hewitt analysis indicates?

The PwC study: "Behind the numbers Healthcare cost trends for 2008" from the PricewaterhouseCoopers' Health Research Institute, released this June 2007 is available at http://pwchealth.com/cgi-local/hregister.cgi?link=reg/numbers2008.pdf. The following is the PwC expected Medical Cost Trends for 2007 and 2008:

  2007 2008
PPOs 11.9% 9.9%
HMO/POS/EPO 11.8% 9.9%
Consumer Driven 10.7% 7.4%

The Hewitt Associates analysis can be reviewed in their June 28, 2007 press release "HMOs Propose Highest Rate Increases in Four Years, According to Hewitt Analysis" at http://www.hewittassociates.com/Intl/NA/en-US/AboutHewitt/Newsroom/PressReleaseDetail.aspx?cid=4159 . Overall, Hewitt projects these initial 2008 rates increases to average 14.1%, compared with 11.7% in 2007 and 12.4 % for 2006. How different are the final plan rates? Hewitt notes that after plan changes, negotiations and terminations, 2007 average HMO rates increased by 8.2%. If that same differential held for 2008, final 2008 rate increases would be around 9.9%, which if you round it, does bring us back to double digits even for the final numbers.

So, let's spin the premium rate wheel of fortune and see if we're headed into pressures for change or status quo as we inch along towards the election year.

Page 1 2