Search

Entries in Riddle, Clive (397)

Friday
Sep202019

Health Plan Medical Ratio and Administrative Expense Snapshots

by Clive Riddle, September 20, 2019

Two reports on health plan performance were released this week:  Mark Farrah Associates issued an analysis brief providing insights into mid-year profitability for commercial and government lines of health insurance business entitled: Health Insurance Segment Mid-Year 2019 Profitability; and Sherlock Company's September 2019 Plan Management Navigator summarized cost trends among Medicare-focused plans.

Key findings from the Mark Farrah report on health plan profitability include:

  • At the end of second quarter 2019, the average medical expense ratio for the Individual segment was 73.9%, as compared to 69.0% the previous year.
  • Growth in medical expenses pushed the average medical expense ratio for the Employer-Group segment up to 81.4% for 2Q19 from 80.5% in 2Q18.
  • For Medicare Advantage, premium growth outpaced increases in medical expenses pushing the medical expense ratio down to 84.7% from 85.5% in 2Q18.
  • An increase of 9.7% in medical expenses per member per month pushed the medical expense ratio for Managed Medicaid up to 92.0% from 88.8% in 2Q18.

Their report concludes “at mid-year 2019, all four health care segments are signifying reduced levels of profitability for health insurers over 2018.  Due to the minimum MLR constraints placed upon the individual segment, the stagnation of premium growth along with the rise in the mid-year med expense rations is not surprising, especially after the underwriting gains reaped in 2018.”

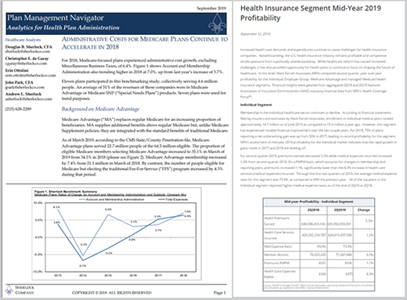
While Mark Farah Associates focused on profitability driven by medical expenses, Sherlock Company reported on administrative expenses and found that “for 2018, Medicare-focused plans experienced administrative cost growth, excluding Miscellaneous Business Taxes, of 6.4%. Account and Membership Administration [expenses were] also trending higher in 2018 at 7.0%, up from last year’s increase of 3.7%.

For Medicare-focused plans, they found “High cost Medicare Advantage grew at a median rate of 4.1%, Medicare SNP grew at a median rate of 5.7%, while low cost Medicaid increased at a median rate of 1.1%. The Commercial Insured product membership fell by a median rate of 2.1%, while Commercial ASO grew at a median rate of 3.5%. Overall, commercial membership decreased by 1.9%. Comprehensive membership in continuous plans fell by a median rate of 1.5%.

Friday
Sep202019

Health Plan Medicare Ratio and Administrative Expense Snapshots

by Clive Riddle, September 20, 2019

Two reports on health plan performance were released this week:  Mark Farrah Associates issued an analysis brief providing insights into mid-year profitability for commercial and government lines of health insurance business entitled: Health Insurance Segment Mid-Year 2019 Profitability; and Sherlock Company's September 2019 Plan Management Navigator summarized cost trends among Medicare-focused plans.

Key findings from the Mark Farrah report on health plan profitability include:

  • At the end of second quarter 2019, the average medical expense ratio for the Individual segment was 73.9%, as compared to 69.0% the previous year.
  • Growth in medical expenses pushed the average medical expense ratio for the Employer-Group segment up to 81.4% for 2Q19 from 80.5% in 2Q18.
  • For Medicare Advantage, premium growth outpaced increases in medical expenses pushing the medical expense ratio down to 84.7% from 85.5% in 2Q18.
  • An increase of 9.7% in medical expenses per member per month pushed the medical expense ratio for Managed Medicaid up to 92.0% from 88.8% in 2Q18.

Their report concludes “at mid-year 2019, all four health care segments are signifying reduced levels of profitability for health insurers over 2018.  Due to the minimum MLR constraints placed upon the individual segment, the stagnation of premium growth along with the rise in the mid-year med expense rations is not surprising, especially after the underwriting gains reaped in 2018.”

While Mark Farah Associates focused on profitability driven by medical expenses, Sherlock Company reported on administrative expenses and found that “for 2018, Medicare-focused plans experienced administrative cost growth, excluding Miscellaneous Business Taxes, of 6.4%. Account and Membership Administration [expenses were] also trending higher in 2018 at 7.0%, up from last year’s increase of 3.7%.

For Medicare-focused plans, they found “High cost Medicare Advantage grew at a median rate of 4.1%, Medicare SNP grew at a median rate of 5.7%, while low cost Medicaid increased at a median rate of 1.1%. The Commercial Insured product membership fell by a median rate of 2.1%, while Commercial ASO grew at a median rate of 3.5%. Overall, commercial membership decreased by 1.9%. Comprehensive membership in continuous plans fell by a median rate of 1.5%.

Thursday
Sep122019

Costs & Transparency Number One for 2020 on HCEG’s Top 10 List

By Clive Riddle, September 12, 2019

Once  September is upon us and Pumpkin Spice lattes invade your nearest Starbucks, Christmas decorations should be arriving any day at your nearest Costco, and its not too early to think about what  are the top issues we will be facing in the business of healthcare in new year ahead.

 The Healthcare Executive Group has been doing exactly that for the past decade, presenting their top 10 list of issues at this time for the next year, have announced that for 2020 “Costs & Transparency was voted as the #1 issue/challenge facing healthcare by over 100 C-Suite and director level executives in the industry.”

HCEG explains that “executives from payer, provider and technology partner organizations were presented with a list of over 25 topics. Initially compiled from webinars, roundtables and the 2019 Industry Pulse Survey, the list was augmented by in-depth discussions during the [HCEG Annual] Forum, where industry experts explored and expounded on a broad range of current priorities within their organizations.”

Ferris W. Taylor, HCEG Executive Director in a statement comments that “It shouldn’t be surprising that costs and transparency is at the top of the list along with the consumer experience and delivery system transformation. Data, analytics, technology and interoperability are still ongoing challenges and opportunities. At the same time, executives need to be cautious, as individual health, consumer access, privacy and security are on-going challenges that also need to remain as priorities.”

Here, verbatim is the 2020 HCEG Top 10 Challenges, Issues and Opportunities:

1. Costs & Transparency - Implementing strategies and tactics to address growth of medical and pharmaceutical costs and impacts to access and quality of care.

2. Consumer Experience - Understanding, addressing and assuring that all consumer interactions and outcomes are easy, convenient, timely, streamlined,  and cohesive so that health fits naturally into the “life flow” of every individual’s, family’s and community’s daily activities.

3. Delivery System Transformation - Operationalizing and scaling coordination and delivery system transformation of medical and non-medical services via partnerships and collaborations between healthcare and community-based organizations to overcome barriers including social determinants of health to effect better outcomes.

4. Data & Analytics -  Leveraging advanced analytics and new sources of disparate, non-standard, unstructured, highly variable data (history, labs, Rx, sensors, mHealth, IoT, Socioeconomic, geographic, genomic, demographic, lifestyle behaviors) to improve health outcomes, reduce administrative burdens and support transition from volume to value and facilitate individual/provider/payer effectiveness.

5. Interoperability / Consumer Data Access - Integrating and improving the exchange of member, payer, patient, provider data and workflows to bring value of aggregated data and systems (EHR’s, HIE’s, financial, admin and clinical data, etc) on a near real-time and cost-effective basis to all stakeholders equitably.

6. Holistic Individual Health - Identifying, addressing and improving the member/patient’s overall medical, lifestyle/behavioral, socioeconomic, cultural, financial, educational, geographic and environmental well-being for a frictionless and connected healthcare experience.

7. Next Generation Payment Models - Developing and integrating technical and operational infrastructure and programs for a more collaborative and equitable approach to manage costs, sharing risk and enhanced quality outcomes in the transition from volume to value. (bundled payment, episodes of care, shared savings, risk-sharing, etc).

8. Accessible Points of Care - Telehealth, mHealth, wearables, digital devices, retail clinics, home-based care, micro-hospitals; and acceptance of these and other initiatives moving care closer to home and office.

9. Healthcare Policy - Dealing with repeal/replace/modification of current healthcare policy, regulations, political uncertainty/antagonism and lack of a disciplined regulatory process. Medicare-for-All, single payer, Medicare/Medicaid buy-in, block grants, surprise billing, provider directories, association health plans, and short-term policies, FHIR standards, and other mandates.

10. Privacy / Security - Staying ahead of cybersecurity threats on the privacy of consumer and other healthcare information to enhance consumer trust in sharing data. Staying current with changing landscape of federal and state privacy laws.

Corresponding with Executive Director Ferris Taylor, I asked who the list has changed and evolved during the past five years. Ferris replied that “everything has changed in healthcare in the last 5 or so years and that is reflected in the changes in the HCEG Top 10. The Affordable Care Act was really the 'accessible care act' - upwards of 20 million more people now have insurance but affordability in terms of premiums and escalating deductibles have affected everyone. It shouldn't be surprising then that cost and transparency has gone to the top of the list. For 2020, the HCEG Top 10 relate much more to how central the consumer is for all stakeholders. Healthcare is finally coming into the 21st century with digital technology, holistic individual health and a focus on the consumer journey in everything we do." 
Friday
Aug232019

Key Consumer Touchpoints: Patient Bills and Patient Reviews

by Clive Riddle, August 23, 2019

Patient bills and patient reviews and two consumer touchpoints with significant business impact for providers. Two papers have just been released with survey results on these topics.

OODA Health in partnership with HIMSS has just released a 7-page report: Why Patient Payments are a System Issue, that examines “how consumer healthcare payment dysfunction affects all healthcare stakeholders, creating unforeseen system-wide issues and interfering with patient care. The study surveyed executives from U.S. hospitals and health systems, health insurers, payers and health plan administrators.”

Their survey found: 

  • Two-thirds of clinicians indicated that dealing with patient collections takes time away from patient care
  • Providers say 44% of patients are frequently distracted by bills and payment concerns, resulting in a lower level of compliance and adherence to medical plans
  • 67% of providers use patient collections to justify rate increases during payer negotiations
  • 85% of payers report that member satisfaction drives benefit design, at least to a moderate extent
  • 63% of payers report they want greater insight into how plan complexity is experienced by the member
  • 4% of payers indicated that having actual consumer payment data would improve their models

Meanwhile PatientPop has just released a 17-page white paper, their second annual study: Healthcare Providers Survey Report: Online Reputation Management,  in which they surveyed 233 healthcare providers nationwide about their online reputation management experiences to learn more and identify trends. PatientPop found that: 

  • 47.6% of healthcare providers say they’re not sure how to positively affect their reputation. 
  • 76.1% of healthcare providers worry about receiving negative reviews from patients; 41% are very or extremely concerned. 
  • 89.9% of healthcare providers have seen reviews of their practices online. 
  • More than half of healthcare providers say they have seen reviews of their practice on Google and Yelp. 
  • 64.5% of healthcare providers have visiting patients who say they’ve read a review of their practice. 
  • 52.2% of practices spend 10+ hours a week on administrative tasks related to patient communication. Of those, 34.7% spend 30+ hours a week.


Friday
Aug162019

Ten Things to Know From the NBGH Employer Survey 

By Clive Riddle, August 16, 2019

The National Business Group on Health has released their annual study - The 2020 Large Employers' Health Care Strategy and Plan Design Survey, which found “employers project the total cost of health benefits will rise 5% in 2020, taking cost management initiatives into account. That increase is identical to 2019’s projected increase - but actual costs are coming in lower. Large employers reported the actual increase in 2018 was 3.6%.”

For comparison, PwC's Health Research Institute in their June report: Medical cost trend: Behind the numbers 2020, projected which projects the 2020 trend to be a six percent cost increase.  In late July Milliman released their 2019 Milliman Medical Index, a 12-page report and their 15th annual analysis that "measures healthcare costs for individuals and families receiving coverage from an employer-sponsored preferred provider plan (PPO). For 2019, they found overall healthcare costs for a hypothetical family of four have reached $28,386, an increase of 3.8% from the year prior.

Here’s ten things to know from this year’s NBGH study:

  1. Total cost of health care per employee including premiums and OOP is estimated to be $14,642 for 2019 and $15,375 in 2020.
  2. The employers will cover contribution is about 70% of costs while employees will bear about 30%, 
  3. 44% of employers ranked musculoskeletal issues as the top condition impacting their costs. 85% ranked it among the top three conditions.
  4. The top two listed large employer initiatives for 2020 were: (1) Implement more virtual care solutions - 51%; (2) More focused strategy on high-cost claims - 39%
  5. 31% of employers plan to implement an ACO or high performance network in select markets in 2020
  6. 49% of employers plan to pursue an advanced primary care strategy in 2020, and another 26% are considering one by 2022.
  7. 34% of employers will deliver advanced primary care through an onsite or near-site health center 
  8. 85% of employers rate high-cost drugs as the number one or two most concerning pharmacy issues.
  9. 20% of employers will have a point of sale prescription rebate program in 2020, but 67% favor a model based on net price of medications with no rebate as an alternative.
  10. The number of employers offering full replacement consumer-directed health plans will shrink to 25% in 2020, down from 30% this year and 39% in 2018.


Friday
Aug092019

The Latest on Physician Burnout

By Clive Riddle, August 9, 2019

InCrowd has just released their 16-page 2019 Physician Burnout Survey report - a follow-up to their 2016 burnout research, asking their participating physicians how they’re coping with job-related stress. They found “sixty-eight percent of US-based physicians surveyed reported experiencing burnout at some level,” and that “primary care physicians (PCPs) report higher burnout rates than specialists, with 79% of PCPs personally experiencing burnout compared with 57% of specialists. And, more than a third of InCrowd physicians surveyed said they would not recommend their profession to a young family member.”

The report also shares findings that: 

  • Burnout is highest among younger physicians, with those in their 30s and 40s reporting highest rates of burnout (74%), and burnout rates dropping thereafter.
  • Hospital employees report slightly worse metrics for addressing burnout (20% effective) compared to those who work across private practices (27% effective).
  • Those who report that their facilities effectively address burnout credit workplace initiatives that improve workflow (46%), provide schedule flexibility (45%), and support wellness (41%).
  • When asked what actions their facilities could take to alleviate the issue of physician burnout, over half of respondents report that increased support staffing (66%), mandatory vacation time or half-days (57%), and reduced patient volume (56%) are likely to help. 

InCrowd notes their findings are “higher than the 43-54% range found in MedScape’s 2019 national report yet lower than the 80% of The Physicians Foundation/Merritt Hawkins biennial survey of September 2018. With PCPs, however, InCrowd found nearly 80% burnout levels—dramatically higher than the 43.9% cited in an American Academy of Family Physicians (AAFP) study of March 2019, which itself reflected a decline from 54.4% in 2014.”

Last month, Spok, Inc. released a paper: "Clinician Burnout in Healthcare: A Report for Healthcare Leaders" providing survey results from over 470 clinical staff at U.S. hospitals and health systems. in which clinician perception of burnout was measured. 92% of clinicians said burnout is “a public health crisis that demands urgent action.” 

When asked "what prevents clinicians from seeking help for potential symptoms of burnout, the No. 1 obstacle cited by respondents (65%) was that their organization lacks institutional attention and resources. When asked how often their organization leaders discuss burnout, 47% said rarely or never."  When asked "whether increased or ineffective technology contributes to the risk of clinician burnout, the vast majority (90% of all respondents) strongly or moderately agreed. And 89% of respondents said burdensome or increased workload (not related to direct patient care) is the biggest factor that contributes to this risk."

The Spok survey also found:

  • 70% experience symptoms of burnout "considerably” or “a great deal.
  • 95% believe improving EHR usability will be at least somewhat helpful
  • 30% of respondents said their organizations are improving EHR usability
  • Nurses use an average of 4.1 technology systems daily 
  • Physicians use an average of 3.9 systems daily and clinical leaders 3.5
  • 20% reported mental health treatment or support is available
  • 13% have a chief wellness officer or equivalent
  • 11% reported not experiencing risk factors including work-related stress, lost satisfaction, or a loss of efficacy in their own work

The Spok survey certainly lays much of the problem at the lap of HER. The InCrowd survey asked for suggestions on how to reduce burnout and “more than half (51%) of those providing additional recommendations suggest improving processes related to administrative burden: 23% suggest employing scribes, 23% advocate for reduced documentation, and 5% propose scheduling more time for charting.” 

Friday
Aug022019

Two Papers on the Health Plan Medicare Opportunity

By Clive Riddle, August 2, 2019 

Oracle has released an Executive Insight paper on the Opportunity Ahead for Agile and Efficient Medicare Advantage Plans,  cautioning that “While the opportunity is great, MA plans are not automatically a wise or profitable business decision for all health insurers. There is growing competition as new players enter the market, and cost and margin pressures continue unabated. To make the most of this opportunity, MA plans must look to accelerate innovation while optimizing costs across their enterprises— from marketing and enrollment to plan configuration, claims processing, compliance, and renewal.”

They report on three development plans should consider now:

  1. It is “Time to flex strength with expanded flex benefits. In 2019, MA plans were cleared to offer new flex benefits, designed to move plans toward expanded population health capabilities.”
  2. “MA plans look to differentiate on other fronts and deliver high levels of service—without placing profitability and stability in peril.”
  3. Payers are eager to bring new urgency and focus to improving claims accuracy and delivering innovative provider payment models.

HealthEdge has just released results of its Voice of the Market Survey, a study of 201 health insurance executives directly involved in Medicare lines of business. 92% responded that they are trying to grow their Medicare Advantage book of business faster than their traditional Medicare Supplement business.


Here’s some key findings from their survey:

  • 53.2% said the value-based model of Medicare Advantage significantly factors into a desire to grow the business, while 42.8% said it moderately factor in.
  • Expanding to new service areas ranked first in level of importance as the steps being taken to attract new Medicare and Medicare Advantage members, followed by (2) Appealing to tech-savvy digital consumers; (3) Providing incentives for healthy behaviors; (4) Addressing social determinants of health; and (5) Marketing/advertising to prospective members
  • Applicable steps above get re-ordered somewhat when ranking importance to retain current Medicare and Medicare Advantage members: (1) Appealing to tech-savvy digital consumers; (2) Addressing social determinants of health; (3) Providing cost transparency; (and 4) Providing incentives for healthy behaviors; (5) Providing education services to members about their benefits
  • There is not consensus on what is the biggest challenge to acquiring new members in the Medicare or Medicare Advantage (MA) line of business.  29.4% said it was funding/executing marketing outreach to  attract new members; 23.8% said competitors who  dominate the market; 22.4% said offering the variety of  plans necessary to satisfy members; and  19.9% answered differentiating  between MA and  traditional Medicare.
  • When asked “what is the biggest external challenge your organization faces in the Medicare and Medicare Advantage line of business.” Competitors seem top of mind, with 34.3% responding “competition”; and another 29.9% stating “members unwilling to switch plans from a competitor. Other responses were 19.9% replying “regulations” and 15.9% saying “member demands.”


Friday
Jul192019

Overconfident Healthcare Organizations? Could Be According to Healthcare Cybersecurity Survey 

By Clive Riddle, July 19, 2019

LexisNexis Risk Solutions in collaboration with Information Security Media Group has released results from their recent survey of hospitals, medical groups and payers, in their new 18-page report The State of Patient Identity Management, which found 50% are confident they have the necessary controls in place to prevent unauthorized access to patient information, 58% believe their portal cybersecurity is above average (and only 6% feel they are below average), yet 35% don’t deploy multifactor authentication.

To digress, some insight into those results can be gained from reading last week’s mcolblog post by Kim Bellard on Our Dinning-Kruger Healthcare System, which discusses the Dunning Kruger effect involving “the cognitive bias that leads people to overestimate their knowledge or expertise,” illustrated in the world of NPR’s Lake Wobegon – where “all the children are above average.” 

88% of the organizations surveyed had patient/member portals, and 93% use username and password as the patient portal authentication method. 65% deploy multifactor authentication, with 39% using a knowledge-based Q&A for verification, 38% using email verification, and 13% deploy device identification. 65% report that their individual state budgets for patient identity management will not increase in 2019.

Here’s the top three cybersecurity takeaways of the report according to LexisNexis:

  1. Traditional authentication methods are insufficient: As a result of many healthcare data breaches, hackers have access to legitimate credentials; users are also easily phished. Therefore, traditional username and password verification are considered an entry point, not a barrier, and alone cannot be relied upon to provide a confident level of security.
  2. Multifactor authentication should be considered a baseline best practice: HCOs should rely on a variety of controls, ranging from knowledge-based questions and verified one-time passwords to device analytics and biometrics to authenticate users based on the riskiness of the transaction. The more risky the access request is, the more stringent the authentication technique should be.
  3. The balance between optimizing the user experience and protecting the data must be achieved in an effective cybersecurity strategy: HCOs need to make it easy for patients and partners to access records while ensuring adequate data protection. To do this, an HCO's cybersecurity strategy should layer low to no-friction identity checks up front, making it easier for the right users to get through and layer more friction-producing identity checks on the back end that only users noted as suspicious would complete.
Friday
Jun212019

Ten Takeaways From PwC’s Medical Cost Trend Behind The Numbers 2020

By Clive Riddle, June 21, 2019 

PwC's Health Research Institute has just released their 14th annual report on medical cost trends: Medical cost trend: Behind the numbers 2020, which projects the 2020 trend to be a six percent cost increase. As PwC's HRI describes their 47-page report, they project "the growth of private medical costs in the coming year and identifies the leading trend drivers.... based on the best available information through June 2019. HRI conducted 55 interviews from February through June 2019 with health industry executives, health benefits experts and health plan actuaries whose companies cover more than 95 million employer sponsored large group members about their estimates for 2020 and the factors driving those trends. Also included are findings from PwC’s 2019 Health and Well-being Touchstone Survey of more than 550 employers from 37 industries as well as PwC HRI’s national consumer survey of 2,500 US adults."

Here’s Ten Takeaways from their 2020 report: 

  1. Small Uptick: The Medical Cost trend, still rounding to double digits in 2007 (11.9%) and 2008 (9.9%), trended downwards subsequently, to round to six percent since 2016 (6.2%), but have ticked up since the low-water mark of 5.5% in 2017 (and 5.7% in 2018-2019.)
  2. Price, Not Utilization: “Prices have been a larger component of employer benefit costs than utilization since 2004; utilization has hovered around zero percent growth since 2006. Utilization by individuals with employer-based insurance decreased by 0.2 percent from 2013 to 2017 while prices rose 17 percent during that time.”
  3. Impact of High Deductibles: “Average deductibles for employer-sponsored plans tripled between 2008 and 2018. This increase likely has led to a low utilization trend because employees are delaying or forgoing care due to their deductible.”
  4. Stall in HDHP Growth: “The shift to HDHPs by employers seems to have stalled. With 84 percent of employers offering an HDHP option in 2019 and a tight labor market, employers may not be as quick to push HDHPs in 2020.
  5. Acceleration in Retail Rx Spending: “Starting in 2020, retail prescription drug spending growth for private health insurance will begin to increase, hitting between 3 percent and 6 percent annually through 2027.24 The growth in spending can be attributed to the waning impact of generics on the market and the introduction of new drugs.”
  6. Specialty Drug Million Dollar Drugs Pipeline: The portion of total retail drug spending on specialty drugs continues to grow. “We are at an inflection point with drugs in the pipeline. We thought hep C was expensive at nearly $100,000 per treatment. Many drugs in the pipeline are life-altering and come with a price tag of $1 million to $2 million per treatment.”
  7. Growth in Chronic Disease Spending: "Spending by employers on individuals with chronic diseases is nearly quadruple [3.5x] that of healthy individuals while spending on individuals with complex chronic diseases is eight times higher" [8.2x].
  8. Growth in Onsite Clinics: “38 percent of large employers offered an onsite health clinic in 2019, up from the 27 percent that offered a clinic in 2014. An additional 13 percent said they were considering adding one.”
  9. Telehealth Potential: “49 percent of consumers with employer coverage said they are willing to use telehealth in place of an in-person visit.”
  10. Underutilized Wellness and Prevention programs: “For decades, employers have invested in health and wellness and prevention, yet participation remains low.....The small population of employees who participate in their employers’ health and wellness programs generally believe the programs have had a positive impact on their health.”


Thursday
Jun132019

Analyzing Blue Cross Blue Shield Plan Administrative Costs

By Clive Riddle, June 13, 2019

Sherlock Company in the June issue of their Plan Management Navigator examines administrative cost trends for Blue Cross Blue Shield Plans, analyzing year end 2018 vs 2017 data.  They found that costs “increased by 5.5% per member, up from an increase of 5.1% for 2017. Reweighting to eliminate the effects of product mix differences between the years, per member costs increased by 6.7% as compared with 5.9% in 2017. ASO/ASC increased as commercial insured membership declined. Medicare Advantage continued to grow rapidly.”

 Their key findings included:

  • Most clusters of expenses grew at rates less than last year.
  • Uniquely, Account and Membership Administration’s growth rate increased.
  • Growth in Information Systems was the single most important reason for administrative expense increase in 2018.
  • The shift in favor of products and market segments that are lower cost to administer muted the real growth.


Sherlock’s benchmarking study “analyzes in-depth surveys of 14 Blue Licensees serving 37 million members. Surveyed Plans comprise 52% of the members of Blue Cross Blue Shield Plans not served by publicly-traded companies.” 

Why does this benchmarking matter? Because the non-publicly traded BCBS plans provide a meaningful universe to benchmark, and plan administrative expenses are highly scrutinized, and certainly more controllable than medical expenses. As Doug Sherlock states, “in the current environment, optimizing administrative expenses is a high priority for health plan managers. Plans have completed their adaptation to the Affordable Care Act and the bulge in Exchange and Medicaid members. Plus, administrative expense visibility has been heightened by the rhetoric of presidential candidates.”

Here’s some key specific data from their report:


  • For the universe as a whole, the median total costs were $38.51 per member per month, higher than last year’s $34.99. 
  • By functional area, median pmpm costs were: Sales & Marketing $9.21; Medical & Provider Management $5.03; Account and Membership Administration $16.10 and Corporate Services $5.92
  • Median pmpm costs by product categories included: Commercial insured $49.84; Commercial ASO $28.32; Medicare Advantage $112.08; and Medicaid $46.08.
  • The median administrative expense ratio was 9.0% compared with 8.9% last year.
  • The median administrative expense ratio by product categories included: Commercial insured 10.8%; Commercial ASO 7.1%; Medicare Advantage 12.5%; and Medicaid 9.3%.
  • Staffing ratios increased by 6.8%, especially in Information Systems. 
  • Approximately 19 FTEs serve every 10,000 members in the commercial products. 
  • Compensation, including all benefits except OPEB, increased at a median rate of 3.8%. 
  • The median proportions of FTEs that were outsourced was 11.0%.
  • After the effect of the Miscellaneous Business Taxes, total administrative expense PMPM increased by 17.9% compared with a decline of 2.3% in the prior year 


Friday
Jun072019

Consumer Surveys on SDOH Experiences: Kaiser, McKinsey and Waystar

By Clive Riddle, June 7, 2019 

Kaiser Permanente has just released results of consumer SDOH survey they commissioned entitled Social Needs in America, which found “68% of Americans surveyed reported they experienced at least one unmet social need in the past year. More than a quarter of those surveyed [28%] said that an unmet social need was a barrier to health, with 21% prioritizing paying for food or rent over seeing a doctor or getting a medication.”  In two other recent consumer SDOH survey reports, one [Waystar] found the same exact percentage [68%] reporting one or more unmet needs, while the other [McKinsey] found a lower figure [53%.] 

Here’s some of the Kaiser survey’s other detailed findings:

Respondents that frequently or occasionally experience stress include:

  • 39%  over meeting their family’s needs for food/balanced meals;
  • 38% over social relationships needs;
  • 35% over meeting housing needs; and,
  • 32% over transportation needs

Respondents believe these factors are important to overall health:

  • stable housing (89%)
  • balanced meals (84%)
  • reliable transportation (80%); and
  • supportive social relationships (72%) 

35% lack confidence that they could identify the best resource if they or a family member needed to use community resources relating to transportation, food, housing, or social isolation. 

42% would turn to their medical services provider when looking for information on community resources to help with social needs, and 30% would turn to their health insurance provider for this information.

Respondents are supportive of medical service providers assessing social needs;

  • 93% say their medical provider should ask about access to
  • food and balanced meals;
  • 83% say their medical provider should ask about safe and stable housing;
  • 78% say their medical provider should ask about social relationships and
  • isolation; and
  • 77% feel that their medical provider  should ask about transportation to work, school, appointments, or activities

Mckinsey examined consumer interest in SDOH offerings and how SDOH impacted healthcare utilization rates in their 2019 Consumer Social Determinants of Health Survey report, released in April, which found 53% reported they were adversely impacted by at least one SDOH factor, with food security being the most commonly reported unmet need (35%), followed by safety (25%) housing (21%) social support (17%) and transportation (15%). McKinsey found that 45% of respondents with unmet social needs reported high healthcare utilization, compared to 21% of respondents reporting no unmet needs. 85% of respondents indicated they would use a social program offered by their health plan.

Waystar released results of their consumer SDOH survey in December, finding:

  • 68% of consumers have at least some level of SDoH challenge and 52% have a moderate to high SDoH risk in at least one category.
  • Patients with SDoH issues are 2.5 times more willing to talk about those issues with clinicians than they are with payers
  • Patients with high SDoH risk are more than 20 times more likely to miss a medical appointment at least once a month
  • Medicare and Medicaid, have the largest high-stress share with 33 percent having high stress in three or more areas, compared to 21 percent of the commercial insurance population being "high risk."

Friday
May312019

ACA Exchange 2020 Final Rule Changes and Survey of Exchange Health Plan Participation and Expectations

By Clive Riddle, May 31, 2019 

Last month CMS issued their final rule with ACA benefit and payment parameters for 2020. Their changes for 2020 included: 

  • The method for calculation of premium assistance for lower-income enrollees (projected to lower the total amount of financial assistance provided by $900 million, when compared with 2019, and result in 100,000 fewer exchange enrollees in 2020.)
  • Allowing plans to make mid-year changes to their drug formularies
  • Allowing plans to implement cost-sharing requirements if enrollees choose a brand-name drug when a medically appropriate generic version of the drug is available (even when out-of-pocket spending maximum is reached)
  • Allowing plans to implement copayment accumulator programs for prescription drugs
  • Lowering user fees for the 2020 coverage year by half a percentage point
  • Increases maximum out-of-pocket spending limits by 3.2%, from $7,900 to $8,150 for individual plans and from $15,800 to $16,300 for family plans      


How will these changes, and overall market forces, impact health plan participation in the ACA exchanges for 2020? eHealth has just released survey results from 17 plans that collectively cover 80 million lives that participate in ACA exchanges, that found “more than twice as many insurers intend to increase plan offerings for 2020 as compared with 2019, with premiums holding fairly steady.”


Here’s some of their detailed findings: 

  • 45% intend to add to the number of ACA plans they'll offer in 2020, compared to 21% who did so for the 2019 plan year
  • 42% expect to raise premiums between 5 and 10 percent over 2019 rates. 33% do not expect to make any noteworthy changes to premiums, while 23% expect to reduce monthly premiums by 5 percent or more.
  • 69% said that sales during the last open enrollment period were within 10 percent of their expectations. 15% reported that sales outpaced expectations by 10 to 15 percent, while another 15% of said sales were 10 percent or more below expectations.
  • 71% said they are paying attention to public discussions about "Medicare for all" but don't expect major changes, compared to 67% in 2018


Friday
May172019

The Short List of Major Healthcare Implications from A Declining Birth Rate

By Clive Riddle, May 17, 2019

Like most of the industrialized world. the U.S. birth rate is declining, as evidenced in the new  CDC National Center for Health Statistics National Vital Statistics System May 2019 report on "Births: Provisional Data for 2018."  (the final birth report is scheduled to come out this fall.) The big news from the report is the number of births was the lowest in 32 years, and the fertility rate reached another record low.

Here's highlights from the report: 

  • The provisional number of births for the United States in 2018 was
  • 3,788,235, down 2% from 2017 
  • The general fertility rate was 59.0 births per 1,000 women aged 15–44, down 2% from 2017 a
  • The total fertility rate declined 2% to 1,728.0 births per 1,000 women in 2018
  • Birth rates declined for nearly all age groups of women under 35, but rose for women in their late 30s and early 40s
  • The birth rate for teenagers aged 15–19 was down 7% in 2018 to 17.4 births per 1,000 women
  • Rates declined for both younger (aged 15–17) and older (aged 18–19) teenagers
  • The cesarean delivery rate decreased to 31.9% in 2018; the low-risk cesarean delivery rate decreased to 25.9%
  • The preterm birth rate rose for the fourth year in a row to 10.02% in 2018
  • The 2018 rate of low birthweight was unchanged from 2017 (8.28%)

In a Q&A session with report author Brady E. Hamilton, Ph.D. posted in the NCHStats blog, Hamilton is asked if there was a specific finding that surprised him, which he replied "the record lows reached for the general fertility rate, the total fertility rate and birth rates for females aged 15-19, 15-17, 18-19, and 20-24 are noteworthy. In addition, the magnitude of the continued decline in the birth rate for teens aged 15-19, down 7% from 2017 to 2018, is also historic." Hamilton was non-committal about the trend going forward, stating “these data do not answer the question of why the number of births dropped in 2018 or if the decline will continue.”


But assuming the trends do continue, which certainly the opinion of many, there are certainly major implications for healthcare, including this short-list: 

  • Impact of reduced demand for hospital and physician OB services
  • Impact of increased births from higher-age mothers, with greater care complexities involved
  • Longer range reduced demand for hospital and physician pediatric services
  • Longer range reduced available Medicare funding from employed workforce, with growing imbalance of senior retired population compared to working population
Friday
May102019

Consumer Insights and Kaiser Initiative on SDOH

By Clive Riddle, May 10, 2019

McKinsey has just published various insights from their 2019 Consumer Social Determinants of Health Survey, which found that compared to those whose social need is met, respondents (2,010 surveyed with government program coverage or uninsured and below 250% of federal poverty level) that:

  • Reported food insecurity were 2.4 times more likely to report multiple ER visits, and 2,0 times more likely to be hospitalized
  • Reported unmet transportation needs were 2.6 times more likely to report multiple ER visits, and 2,2 times more likely to be hospitalized
  • Reported unmet community safety needs were 3.2 times more likely to report multiple ER visits

Encouraging news from the survey for health plan advocates of SDOH was that 85% of respondents reporting unmet social needs said they would use a social program offered by their health insurer. Regardless of their social needs, respondents were interested in these types of health plan SDOH programs as follows: 

  • 50% were interested in grocery store discounts for healthy foods
  • 48% were interested in free memberships at local gyms
  • 45% were interested in a wellness dollar account used towards wellness services of their choice
  • 41% were interested in total reimbursement of home improvement purchases to address health issues
  • 40% were interested in after-hours drop-in clinics at lower or no cost 

Speaking of health plans, Kaiser Permanente has just announced their new Thrive Local initiative, a “a social care coordination platform” with “a network of public agencies and community-based organizations that will support” Kaiser “members to meet their social needs.”


Kaiser says that “starting this summer, closed-loop and bidirectional communication will provide confidence that referral, follow-up and ongoing patient/family engagement happen. Improved cross-sector collaboration and communication will also reduce the unintentional trauma and stigma that our patients and families may experience. Beyond Kaiser Permanente members and patients, community-based organizations will also benefit through improved decision support, automation, and relevance of the referrals they receive from their health system. This connectivity and interoperability between health care and social organizations and agencies will redefine the meaning of ‘provider network’ in this new world as the network of providers of health, health care, and social needs to address total health of our communities.”


Kaiser Permanente is partnering with Unite Us to launch the program, as tells us that Thrive Local within three years “will be available to all of Kaiser Permanente’s 12.3 million members and the 68 million people in the communities Kaiser Permanente serves.


Friday
May032019

CBO: Coverage by Oration

by Clive Riddle, May 3, 2019

 The Congressional Budget Office has been quite busy as of late, preparing reports that can serve as reference resources in response to Orators residing in Congress, the White House and the campaign trail, that are espousing healthcare coverage policy proposals, whether those proposals being orated involve Medicare for All, Medicare for Some, Death to the ACA, or other such schemes.

On May 1st, the CBO released a 34-page report:  Key Design Components and Considerations for Establishing a Single-Payer Health Care System, serving as a roadmap that “describes the primary features of single-payer systems, and it discusses some of the design considerations and choices that policymakers will face in developing proposals for establishing such a system in the United States.”

The report is organized by these categories of components and design considerations: 

  • How would the government administer a single-payer health plan?
  • Who would be eligible for the plan, and what benefits would it cover?
  • What cost sharing, if any, would the plan require?
  • What role, if any, would private insurance and other public programs have?
  • Which providers would be allowed to participate, and who would own the hospitals and employ the providers?
  • How would the single-payer system set provider payment rates and
  • purchase prescription drugs?
  • How would the single-payer system contain health care costs?
  • How would the system be financed? 

In May 2nd, the CBO released a 42-page report: Federal Subsidies for Health Insurance Coverage for People Under Age 65: 2019 to 2029, which “project that federal subsidies, taxes, and penalties associated with health insurance coverage for people under age 65 will result in a net subsidy from the federal government of $737 billion in 2019 and $1.3 trillion in 2029.”

 The report tells us that:

  • Between 240- 242 million people are projected to have health insurance each month during 2019-2029. The number of uninsured is projected to rise from 30 million in 2019 to 35 million in 2029.
  • Net federal subsidies for insured people will total $737 billion in 2019 and $1.3 trillion in 2029.
  • Medicaid and CHIP account for 40 - 45 percent of the federal subsidies, Medicare accounts for about 10 percent, and subsidies for ACA marketplace coverage account for less than 10 percent.

On April 18th the CBO provided a blog post: CBO Releases Four Products Explaining How Its New Health Insurance Simulation Model Works that describes how they generate estimates of health insurance coverage and premiums for the population under age 65, such as for the May 2md Federal Subsidies report.


 Also on April 18th, the CBO released an 11-page report:  Health Insurance Coverage for People Under Age 65:  Definitions and Estimates for 2015 to 2018 that “explains how CBO defines health insurance coverage, describes how CBO combines data from various sources to produce estimates of different types of coverage in past years, and shows such estimates for the years 2015 to 2018.” 


The report:  

  • Describes how CBO defines health insurance coverage (private and public) for people under 65 who are not institutionalized and who are not members of the active-duty military;
  • Describes the individual data sources CBO uses to compile preliminary estimates of historical outcomes, and the limitations of those sources; and
  • Compares preliminary estimates of historical outcomes with CBO’s integrated estimates of coverage (that are consistent with each other and that sum to accurately depict the total population) for 2015 to 2018.
Friday
Apr122019

CVS Caremark PBM Releases Its Own Report Card and Gives Itself A’s

by Clive Riddle, April 12, 2019

CVS Health’s Caremark PBM has just released their annual Drug Trend Report, and tells is that they “blunted the impact of drug price inflation achieving a negative -4.2 percent price growth for non-specialty drugs and a 1.7 percent price growth for specialty drugs. Furthermore, 44 percent of CVS Caremark's commercial PBM clients saw their net prescription drug prices decline from 2017 to 2018.”


In the 12-page report, CVS Caremark notes that while medical costs have increased by 14% since 2013, their member average cost per 30-day Rx decreased 8.4% during that time, from, $11.96 to $10.95. They also remind us Non specialty brand AWP increased 8.1% last year, and specialty brand AWP increased 7.6% last year, while overall U.S. inflation increased 1.9%.

CVS Caremark reports that specialty drugs account for 1% of their Rxs, but 45% of their pharmacy spend.  They cite specialty drug cost growth as the number one trend to keep on your radar going forward. The rest of the top five trends:

2) Integrated management of specialty drug spend that falls under the medical benefit, given 45% of the specialty spend falls under medical benefits

3) Addressing pharma manufacturer innovations in marketing and product protection to reduce market competition

4) Strategies to improve medication adherence for chronic disease patients

5) Identifying “bad actors” through analytics

Friday
Apr052019

Got $285k for Healthcare Costs in Your Retirement Years?

By Clive Riddle, April 5, 2019

West Health and Gallup this week released a 44-page report: The U.S. Healthcare Cost Crisis, with survey results that addressed “the impact of the high cost of healthcare on personal finances, individual healthcare choices and the level of satisfaction with the U.S. healthcare system.”

The survey found “that despite 45% of respondents reporting fears of bankruptcy if a major health event strikes, 1 in 4 skipping a medical treatment due to costs and Americans collectively borrowing an estimated $88 billion to cover healthcare costs in the past year.” The report also tells us that: 

  • When given the choice between a freeze in healthcare costs for the next five years or a 10% increase in household income, 61% of Americans report that their preference is a freeze in costs
  • 76% expect their costs for healthcare will increase even further in the next two years
  • 26% have deferred a treatment
  • 12% borrowed money to pay for healthcare in the past year, including nearly 3 million borrowing $10,000 or more
  • 23% cut back on household spending due to healthcare costs
  • Only 36% of  doctors discuss costs with them in advance of procedures, tests or treatment plans, and 34% discussed costs of prescriptions 

But the concern rightfully is heightened for seniors (age 65+) who have the most immediate and more complex healthcare needs overall, and finite financial resources: 

  • 31% of seniors will be unable to pay for basic healthcare in the next 12 months (41% with annual household income <$60,000)
  • 29% will be unable to pay for medicine in the next 12 months (42% with annual household income <$60,000)
  • 38% said a major health event could lead to bankruptcy 38%  (45% with annual household income <$60,000) 

Fidelity this week released their annual analysis of out of pocket Medicare expenses and funds required for medical expenses with a couple retiring today. 

According to Fidelity, “a 65-year old couple retiring in 2019 can expect to spend $285,000 in health care and medical expenses throughout retirement, compared with $280,000 in 2018. For single retirees, the health care cost estimate is $150,000 for women and $135,000 for men.” Fidelity tells us that “while there’s no surprise that health care costs are a top financial concern in retirement, the past two years combined have seen a slower rise (3.6 percent) than in the previous two (2015-2017), which saw the estimate grow to $275,000 from $245,000 (up a total of 12.2 percent). Even without the same rate of growth, some retirees are still surprised by today’s cost of health care.” 

Fidelity healthcare prescription isn’t surprising – they advocate building savings to cover the expenses, through HSAs:

Friday
Mar292019

Cigna Study: More Stressed + Less Rested + Less Family & Friends Time = America

Cigna has released their 2019 360 Well Being Survey: Well and Beyond, a 15-page report “that explores perceptions of well-being across five key indicators – physical, family, social, financial and work – in 22 countries, including the United States.” Their findings indicate applicable measure for the U.S. are all getting worse – not better. Jose Quesada, Cigna’s Chief Medical Officer, International Markets tells us “we’re seeing high incidences of stress, poor sleep quality and less time connecting with loved ones, which all can have a profound impact on one’s physical health.”

Overall the study found "the global well-being index remained largely steady at 62.0 points, closer to 2017 levels, with a marginal improvement from 2018’s decline;" and that "geographically, India, Saudi Arabia, Nigeria and Indonesia showed the strongest improvement in overall wellness with a rise of between 2.1 and 4.4 points, while the US, New Zealand, Taiwan and Singapore showed slight drops, with New Zealand reporting the largest fall." 

The survey results for Americans include:

  • Only 28% reported being at a healthy weight
  • 33% know their Body Mass Index (BMI)
  • 60%+ know their blood pressure
  • Four of five Americans report feeling stressed
  • Only 25% report employer assistance/support f in managing stress – down 17% from 2018
  • 61% said their employer did not provide or sponsor any workplace wellness program
  • Only 35% report they get sufficient sleep at night, down six points from 2017
  • 32% report having “good quality sleep,” down eight points from 2017
  • 45% attested to feeling excellent/very good about the amount of time spent with family, compared to 51% in 2017
  • 62% of Americans spend sufficient time with friends, down five points from 2018


Friday
Mar152019

An Innovative Acquisition for HCA

by Clive Riddle, March 15, 2019

Nashville-based HCA Healthcare has just announced that HCA will become the majority owner of the parent company of Galen College of Nursing, one of the largest educators of nurses in the nation.  HCA, of course, is one of the nation’s leading providers of healthcare services, comprising 185 hospitals and approximately 1,800 sites of care.

The announcement states that “The innovative new strategic partnership brings together two of the top nursing organizations in the country in order to increase access to nursing education and provide career development opportunities in nursing to improve patient care. With 94,000 registered nurses, HCA Healthcare is one of the largest employers of nurses in the country, with nurses holding positions from bedside caregivers in a variety of healthcare settings to leadership positions throughout the organization.”

Hospital funding and partnerships for nursing education certainly isn’t new. For example, here’s a website providing a state-by-state listing of 123 such hospital arrangements, which they acknowledge is only a partial list.

But what is innovative is to move beyond strategic partnerships with an outright acquisition.  Not only does the move create synergy for HCA’s staff career development, it should also serve as a burse recruitment tool for HCA, in an environment where hospitals compete for nursing staffing.

Furthermore, this perhaps signals that healthcare organizations will continue to peek and climb further out-of-the-box with acquisitions beyond traditional M&A of other healthcare providers.  Deloitte, in a discussion of the Health Plan of Tomorrow that is the subject of an upcoming webinar, writes that "buy, share or build? is a question many health plan leaders will face as they begin this transformation journey. And accessing these capabilities may require an industry-agnostic approach. As new players break the rules around who plays what role in the industry, health plans may need to turn to want might today be considered strange bedfellows: competitors, providers, manufacturers, technology companies, transactional sector companies, and/or other industries for answers."

The same holds true for healthcare providers as for health plans.  And so HCA and Galen seem to be pairing up on a transformative journey as well.

Friday
Mar082019

We’re #1! Healthcare Leads the Way in Travel and Wait Times

by Clive Riddle, March 8, 2019

Altarum recently released a six page report: Travel and Wait Times are Longest for Health Care Services and Result in an Annual Opportunity Cost of $89 Billion” which compiled data for the Bureau of Labor Statistics’ American Time Use Survey. Their study found “waiting times for health care services in particular were much higher than the other service categories, over twice the length of the next closest, veterinary services.”

Alturm reports that “the time spent traveling and waiting for health care services on a day when an individual got care was over 50% of the time spent actually receiving care—45 combined minutes traveling & waiting vs. 76 minutes receiving care (data not shown). Among all time spent on health care related activities (self-care, assisting others, receiving professional care, waiting and travel), travel and waiting for care accounted for 19.7% of the total time spent, on average over two minutes a day or an hour per month.”

Altarum outs a price tag and all this traveling and waiting: “When quantified by applying an individual’s hourly wage as an approximate measure of the economic cost of time spent, travel and waiting costs averaged $89 billion dollars annually from 2006 thru 2017.”  But the really sad news is that “despite significant investments in the United States over this period in improving access to health care through better insurance, the use of innovative delivery systems, and advances in digitizing health care records and automating administrative processes, travel and wait times show no discernable improvements in these data from 2006 to 2017.” 

Vitals, recently acquired by WebMD, has annually released a report on physician wait times, Their most recent report tells us that where you’re traveling to or from makes a big difference in physician waits. Wisconsin has the shortest average wait time of 13 minutes 23 seconds while Alabama comes in as the longest with 22 minutes 19 seconds.  Your wait in Seattle averages 14 minutes 38 seconds (second shortest city– three seconds longer than Milwaukee) while a wait in El Paso comes in as the longest at 26 minutes 50 seconds. 

Vitals also reports that “30 percent of people reported they’ve walked out of an appointment due to long waits. What’s more, 1 in 5 report they’ve changed doctors because of long wait times.”


Page 1 ... 2 3 4 5 6 ... 20 Next 20 Entries »