Search

Entries in Riddle, Clive (397)

Friday
Mar182022

The Continuing Relevance and State of Medigap Plans

By Clive Riddle, March 18, 2022

With such focus in Medicare-World on Medicare Advantage plans, its easy to forget that the continuing relevance of Medigap plans. While there are close to 24 million covered in MA plans, another 14.4 million have Medigap coverage.

AHIP’s Center for Policy Research  has just released a new report: The State of Medicare Supplement Coverage, which examines trends in Medicare Supplement insurance and discussed the financial value these plans offer to seniors and people with disabilities.

Their report found:

  • Among original Medicare enrollees without additional insurance coverage (such as Medicaid, employer-provided insurance, etc.), 53% chose Medicare Supplement coverage in 2020.
  • Between December 2017 and December 2020, the share of original Medicare beneficiaries who purchase Medicare Supplement coverage increased from 35% to 39%.
  • However, in the first pandemic year, national Medicare Supplement 2020 enrollment was 14,395,788 (decreasing by 87,000, or -0.6%). This is in contrast with the consistent rate of growth of 3-4% observed in the three previous years.
  • Medicare enrollees with Medicare Supplement coverage were 3 times less likely to have problems paying medical bills compared to enrollees without Medicare Supplement policies. Only 4% of enrollees with Medicare Supplement coverage reported having difficulty paying medical bills in the last 12 months, compared to 12% of FFS Medicare enrollees without Medicare Supplement coverage.
  • Medigap coverage skews female – at 58%, which is explained at least in part by women’s longevity compared to men. 40% of Medicare Supplement enrollees were widowed, divorced, separated, or never married.
  • A significant number of Medicare Supplement policyholders were individuals with lower incomes: 11% had annual household incomes below $20,000 and 26% had incomes below $30,000. This pattern was more widespread in rural areas, where 17% of Medicare Supplement policyholders had incomes below $20,000

The sources for the 2022 report are the 2020 National Association of Insurance Commissioners (NAIC) data, 2020 California Department of Managed Health Care data, and 2019 Medicare Current Beneficiary Survey (MCBS) results.

Thursday
Mar102022

Google’s Alphabet, Facebook’s Meta, and now Anthem’s Elevance

By Clive Riddle, March 10, 2022

In 2015 Google unveiled Alphabet, a new name to brand the parent holding company separate from the Google identity. Last year, Facebook announced Meta in a similar fashion.  And now, 2,306 miles from Silicon Valley, an announcement emerges from Indianapolis that the separate parent name above the Anthem brand will become Elevance Health. Their announcement states that “the new name underscores the company’s commitment to elevating whole health and advancing health beyond healthcare.”

Anthem President and CEO Gail Boudreaux says the new name reflects “our transformation from a health benefits organization to a lifetime, trusted health partner.” Aetna in 2018 also shed the parent branding identity of a health benefits organization out of necessity, being acquired by CVS Health. While Cigna’s parent identity is still a health benefits organization - Cigna, their PBM Express Scripts acquisition in 2020 rolled up into Evernorth branding with new and existing applicable sister health service solution businesses. Last year Humana – like Cigna still sticking to parent health benefits organization branding – introduced CenterWell as the new brand for a range of its payer-agnostic health care services offerings. Not that this is a brand new concept in the health benefits organization world – UnitedHealth Group announced its "Optum" master brand for its health services businesses in 2011.

In their announcement, Anthem states its “family of companies has evolved to offer products and services beyond traditional health insurance. Through its digital capabilities, pharmacy, behavioral, clinical and complex care assets the company is able to address consumers’ full range of needs with an integrated, whole-person approach. It’s through these diverse assets that the company will deliver on its strategy, drive growth and exceed expectations for consumers.”

And their branding makeover won’t stop there. Anthem tells us that “the corporate rebranding is a first step in the company’s effort to optimize its brand portfolio. While Anthem Blue Cross Blue Shield health plans’ names will not change, the company does expect to streamline the number of other brands in the market to reduce complexities and improve consumer experiences.”

The company does more details in the form of FAQs in their new one-page website: https://www.elevancehealth.com/

Thursday
Jan132022

Five Healthcare Prognosticators That Resonated for 2022

By Clive Riddle, January 13, 2022

We recently provided our own view into 2022, Scrolling Through the Roadmap of 2022 Healthcare Trends, With Sixteen Selected Stops.  Now we’ve scrolled even further to see what others are saying about the coming year in healthcareland. We found five recent prognosticators from different perspectives that resonated, to share with you.

Doctor Marc Harrison, the CEO of Utah’s Intermountain Healthcare provides an excellent outline of 5 Critical Priorities for the U.S. Health Care System in Harvard Business Review. His national agenda includes:

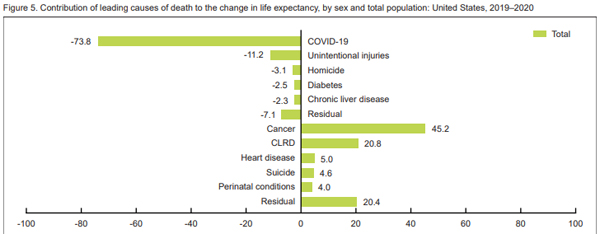
1. Focus on Improving Health (“One of the most striking aspects of Covid-19 is that it often exploits underlying chronic conditions such as diabetes, heart disease, and obesity. With these chronic conditions already at epidemic levels in America, the U.S. population has been ripe to be ravaged by Covid-19.”

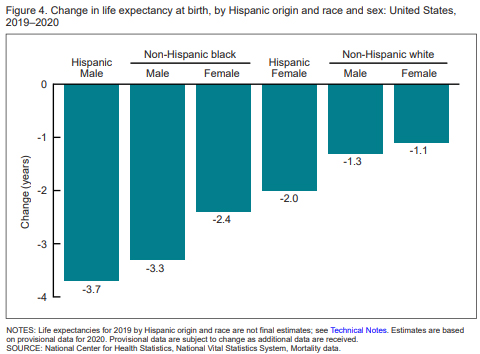
2. Tackle Racial Disparities (“The Covid-19 pandemic has starkly illuminated the profound racial disparities in health care, and these must be rapidly addressed to achieve health equity.”)

3. Expand Telehealth and In-Home Hospital Services (“In health care, we’ve long asked people to come to us for help. We need to change that thinking entirely and become more consumer-centric. We need to care for people closer to their home.”

4. Build Integrated Systems (“Another important confirmation from the pandemic is that integrated health care delivery systems — those that offer their own health insurance plan or do so via a partnership with an external insurer — are better suited to adapt and align incentives to rapidly changing circumstances.”)

5. Adopt Value-Based Care (“The widespread acceptance of value-based care — under which providers, including hospitals and physicians, are paid on the basis of capitation and patient health outcomes — would accelerate the adoption of the above priorities.”

Cigna shared The 4 Biggest Health Care Trends of 2022 and How They Impact America’s Employers:

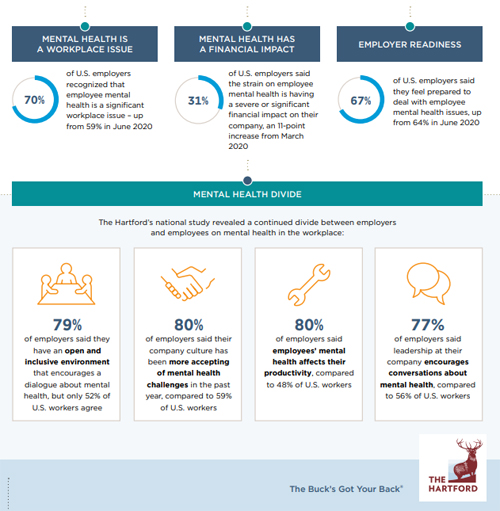
1. Behavioral Health Care: More Need, More Availability, and More of a Focus for U.S. Employers (Cigna saw a 27% increase in outpatient behavioral health visits in 2020 over 2019, and the trend has continued throughout 2021)

2. Working Toward Health Equity: The Role Employers Play ("Health disparities don’t stay at home when we go to work." say Cigna's Kimberly Funderburk, VP and GM for government & education)

3. Drug Costs Continue to Spark Concern for Employers (Cigna reminds us that specialty medications accounted for more than half of pharmacy spend in 2020, although only 2% of the population utilizes these drugs)

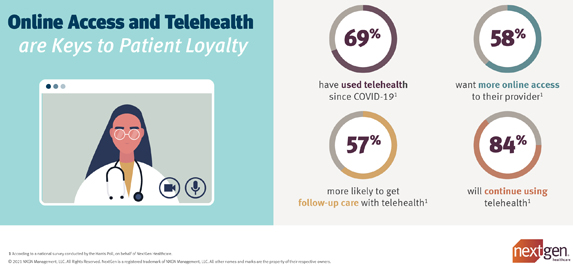
4. Virtual Care Provides Ease, Flexibility, and Can Help Foster a Healthy Workforce (Cigna notes that Pre-pandemic, less than 2% of outpatient behavioral health and medical claims were for virtual visits. Today they make up nearly 25%)

Silicon Velley’s Bessemer Venture Partners offers these 2022 Healthcare Predictions, telling us “opportunities are emerging for leaders to build the connective tissue between the physical and digital worlds in healthcare”:

1. 2022 is the year where IaaS meets digital health

2. An increased focus on hybrid care

3. As the digital health field becomes more crowded, clinical outcomes will become a key competitive differentiator

4. The great resignation poses a breaking point for the supply of clinicians

5. A tech-enabled renaissance for the independent clinician (“Emerging new platforms and tools are helping clinicians become more independent and run successful businesses by enabling flexible hours, additional revenue streams, or owning their audience.”)

6. Value on investment alongside return on investment (“Increasingly, benefit managers are now looking at social factors as well when making purchasing decisions. They are beginning to place a premium on benefits that support diversity, equity and inclusion, as well as employee satisfaction and productivity.”)

7. Teenage years for digital health

In Forbes, Dr. Anita Gupta is a C-Suite Leader from Johns Hopkins School of Medicine penned The Future Of Health: Three Healthcare Trends For 2022:

1. ESG Strategy Focused On Innovation (“The life science industry is moving toward a model of social impact focused on ESG (environment, sustainability, governance) and customized therapies for specific patient populations.”)

2. Data Analytics To Accelerate Biotechnology Innovation (“As our understanding of genetics and disease continues to evolve, the life sciences industry relies on data analytics more than ever before”)

3. Consumer-Facing Telemedicine And Digital Care Solutions (“Finding more consumer-facing solutions that are hybrid models, including both face-to-face and telemedicine, could be the future, while making telemedicine more mainstream and improving consumer access”)

And finally, GE Healthcare published this tech perspective on The Future of the Healthcare Workforce: 5 Predictions For 2022:

1: Innovation to Reduce Burnout Will Continue

2: Clinicians Will Separate the Wheat From the Chaff When It Comes to AI (“the healthcare industry will become increasingly selective about its AI. Clinicians will seek out tools that limit their time in front of a screen and reduce the number of clicks required to input data. Tools that don’t reduce the workload will be ignored.”)

3: Technology Will Help the Workforce To Reduce Healthcare Inequities

4: Telemedicine Will Become Even More Integral to Healthcare Delivery

5: Precision Health Will Revolutionize Healthcare Delivery

Friday
Dec102021

The State of Telehealth as We Slide into 2022

By Clive Riddle, December 10, 2021

A HHS 34-page study released this week by ASPE (Office of the Secretary for Planning and Evaluation) entitled Medicare Beneficiaries’ Use of Telehealth in 2020: Trends by Beneficiary Characteristics and Location says the bottom line on telehealth in the first year of the pandemic was “Medicare telehealth flexibilities mitigated declines in in-person visits during the pandemic in 2020, but there is also evidence of disparities by race/ethnicity and for rural populations.”

The ASPE report found that “the share of Medicare visits conducted through telehealth in 2020 increased 63-fold, from approximately 840,000 in 2019 to 52.7 million. States with the highest use of telehealth in 2020 included Massachusetts, Vermont, Rhode Island, New Hampshire and Connecticut. States with the lowest use of telehealth in 2020 included Tennessee, Nebraska, Kansas, North Dakota and Wyoming.”

Other key findings included:

  • Despite the increase in telehealth visits during the pandemic, total utilization of all Medicare FFS Part B clinician visits declined about 11% in 2020 compared to levels in 2019.
  • Most beneficiaries (92%) received telehealth visits from their homes, which was not permissible in Medicare prior to the pandemic.
  • Prior to the pandemic, telehealth made up less than 1% of visits across all visit specialties but increased substantially in 2020. Telehealth increased to 8% of primary care visits, while specialty care had smallest shift towards telehealth (3% of specialist visits).
  • Visits to behavioral health specialists showed the largest increase in telehealth in 2020. Telehealth comprised a third of total visits to behavioral health specialists.
  • While data limitations preclude clear identification of audio-only telehealth services, up to 70% of these telehealth visits during 2020 were potentially reimbursable for audio-only services.
  • Black and rural beneficiaries had lower use of telehealth compared with White and urban beneficiaries, respectively. Telehealth use varied by state, with higher use in the Northeast and West, and lower in the Midwest and South.

At the same time, CMS released a Medicare Telemedicine Data Snapshot Overview, highlighting claims data between March 1, 2020 and February 28, 2021. In the CMS telemedicine world, they provide these definitions of services that they summarize in their snapshots:

  • Telehealth Visits: Routine office visits provided via video (requires synchronous, real-time audio and/or video communication) with new or established patients. In this snapshot, we group audio-only telehealth in this service category.
  • Virtual Check-ins: Short patient-initiated communications with a healthcare practitioner via telephone or other telecommunications device to decide whether an office visit or other service is needed.
  • E-visits: Non-face-to-face patient-initiated communications with a healthcare practitioner through an online patient portal.

Here’s a peek at two of the seven sections they provide in the overview; they also provide a link to the entire data snapshot file:

Last week, RAND released a new study published in JAMA:   Assessment of Patient Preferences for Telehealth in Post–COVID-19 Pandemic Health Care, which ‘found that people who preferred video visits were more sensitive to out-of-pocket costs than those who preferred in-person visits, as a $20 increase in cost was associated with more people switching from video visits to in-person care.”

RAND reports that “when faced with a choice between an in-person visit or a video visit for a nonemergency health issue, survey participants generally preferred in-person care. Those who were younger, had higher incomes, and had more education were more likely to opt for video visits. Experience with telehealth was associated with a preference for future video visits. Just 2% of those who previously had a video visit were unwilling to do so again…. About 34% of participants did not see any role for video visits in their medical care. These people were generally older, had lower incomes, lived in more-rural areas, and had lower education levels.”

Last month, GoodRx, in collaboration with the American Telemedicine Association released a new report: The State of Telehealth, examining the role the COVID-19 pandemic has played in reshaping virtual care and patient-provider interactions. The report is based on a survey of over 1,000 patients and more than 600 healthcare providers. The key takeaways summarized in their report are:

  1. The COVID-19 pandemic spurred telehealth use, and now both consumers and healthcare providers find value in virtual visits. Both report increased interaction and better outcomes.
  2. Many consumers find value in a hybrid model of care, which combines both in-person visits and telehealth.
  3. No-show rates for telehealth visits may be a pitfall for providers.

Other findings in their report included:

  • About 40% of consumers reported they interacted more with providers because of telehealth appointments
  • 40% of consumers noted that they spend more time with their providers
  • Over 70% of providers said continuity of care was better or much better with telehealth
  • More than 40% of providers reporting it was better than in-person care
  • Before the pandemic, 17% of consumers had used telehealth
  • Now, over 60% of consumers plan on using a hybrid model that combines in-person and telehealth visits
  • More than 80% of providers plan to continue offering telemedicine to patients
  • 60% of providers said telehealth has improved medication adherence and resulted in better conversations about healthcare costs with patients
  • 45% of providers indicated that no-show rates for telehealth appointments were higher or much higher than that of in-person rates
Wednesday
Nov102021

A Trio of Value Based Care Surveys Indicate Technology Opportunities to Address Administrative Challenges

By Clive Riddle, November 10, 2021

The Guidehouse Center for Health Insights has just released analysis of an executive survey in conjunction with HFMA, the 2021 Risk-Based Healthcare Market Trends, that found health systems appear to be going big into risk sharing in 2022, with these percentages of respondents planning to advance into upside/downside risk sharing, professional capitation or global capitation for:

  • Medicare Advantage: 59%
  • Commercial Contracts: 52%
  • CMS APMs: 49%
  • Managed Medicaid: 36%
  • Direct Employer Contracting 33%

Guidehouse's Richard Bajner tells us "We’re seeing increased interest from providers to own the premium dollar through risk-based arrangements. On the other hand, large payers have been more aggressive in building and even investing directly in primary care assets to gain control over the flow of care and better manage services delivered to members, compounding the need for payers and providers to align closely on market strategies. These moves have led health systems to gravitate toward programs more favorable for risk-based collaborations—or payvider models — such as Medicare Advantage, managed Medicaid, and self-insured models."

Guidehouse also share that “provider respondents to the survey cited data integrity, reporting, and the cost of technology (36%) as the No. 1 internal challenge in pursuing increased levels of risk. While half of respondents are building these capabilities in-house, 30% are partnering with payers to support risk-based capabilities and 21% are outsourcing services to a third-party organization.”

Avalere has just released their fifth annual outcomes based contract findings from a 50 question survey of  51 health plans and PBMs, indicating 56% have executed an outcomes based contract for prescription drugs. They also found 12% of payers reported having more than 10 OBCs currently in place, with another 6% of payers have 5–10 OBCs. This total 18% with 5+ OBCs decreased from 25% in 2020, although the portion with 10+ contracts increased from 2020.

Avalere’s Sarah Butler tells us “the significant increase in payers who have more than 10 OBCs in place is showing us that some payers are successfully executing these agreements. At the same time, however, the decline in payers that have tried 1 OBC indicates fewer new entrants in this space.”

Avalere reminds us that "OBCs typically include an agreement between health plans and drug or device manufacturers that ties product reimbursement to specific clinical, quality, or utilization outcomes. Although innovative contracting approaches, such as OBCs, aim to align cost with value, successful implementation and adjudication of an OBC or other type of value-based contract requires significant investment into infrastructure that can support outcomes tracking and coordination among entities involved. Therefore, while some payers may have successful experiences with OBCs, some payers may face significant administrative burden and have limited success in controlling costs."

Speaking of administrative burdens, the Medical Group Management Association (MGMA) recently released their 12-page Annual Regulatory Burden Report, finding that 91% felt the overall regulatory burden on their medical practice over the past 12 months has increased.

The Medicare Quality Payment Program (MIPS/APMs) ranked third (behind Prior Authorizations and COVID-19 workplace mandates) out of nine regulatory issues with regard to physician burden level, with 6% responding MIPS/APM were not burdensome; 6% slightly burdensome; 16% moderately burdensome; and 71% very or extremely burdensome. 79% said the move toward value-based payment (in Medicare/Medicaid) has increased the regulatory burden on their practice, and 70% said the program has not improved the quality of care for their patients, or been successful to date.

It should be noted survey responses were "from executives representing over 400 group practices. 70% of respondents are in practices with less than 20 physicians and 10% are in practices with over 100 physicians. Over 80% of respondents are in independent practices." Regulatory burdens might be anticipated to be greater with independent practices, and those with less than 20 doctors.

92% responded that CMS’ feedback was not actionable in assisting their practice in improving clinical outcomes or reducing healthcare cost related to the MIPS cost performance category, and 88% said the same for the MIPS quality performance category. 93% said positive payment adjustments do not cover the costs of time and resources spent preparing for and reporting under the program.

With respect to APMs, 80% said Medicare does not offer an Advanced APM that is clinically relevant to their practice, but 63% would be interested in participating in an Advanced APM if it was clinically relevant and aligned with their quality goals.

These findings would suggest an opportunity for value based care enabling applications that are designed to achieve program goals but also simplify participation and potentially reduce administrative burdens.

Thursday
Nov042021

Dental and Vision Plan Satisfaction in 2021

By Clive Riddle, November 4, 2021

It’s time to see things eye-to-eye, and tell the tooth, about the state of vision and dental plan satisfaction. Setting Dad jokes aside, J.D. Power has just separately released their  2021 U.S. Dental Plan Satisfaction Report and their 2021 U.S. Vision Plan Satisfaction Report.

The J.D. Power Dental report tells us “overall customer satisfaction with dental plans increases slightly in 2021, driven by a combined 48-point increase in claims and reimbursement satisfaction (on a 1,000-point scale)  and customer service experience.” UnitedHealthcare Dental ranks highest with a score of 806. HumanaDental ranks second (793) and Aetna Dental ranks third (791).

Their vision report tells us “after a decrease in overall satisfaction in 2020, vision plan satisfaction is rebounding as doctor visits increase. Overall satisfaction is 769 (on a 1,000-point scale), an increase from 760 in 2020. Additionally, 5% more members visited their vision providers within the past six months compared with the same time in 2020.” UnitedHealthcare Vision ranks highest in customer satisfaction with vision plan insurers with a score of 825. Aetna Vision (816) ranks second and Davis Vision (775) ranks third.

The 2021 U.S. Dental Plan Satisfaction Report is based on responses from more than 1,203 dental plan members. The 2021 U.S. Vision Plan Satisfaction Report is based on responses from more than 1,110 vision plan members.

Both reports measure customer satisfaction applicable plans based on five factors (in order of importance): cost; coverage; communications; customer service; and reimbursement. coverage; cost; communications; customer service; and reimbursement.

Here are summaries that J.D. Power provided:

Friday
Oct222021

What Collaborative Health Systems, athenahealth and Milliman Found, Sifting Through CMS ACO Performance Data

By Clive Riddle, October 22, 2021

Collaborative Health Systems has announced their affiliate Accountable Care Coalition (ACC) of Southeast Texas, Inc. generated nearly $64 million in shared savings under the Next Generation Accountable Care Organization (ACO) Model for performance years 2017 through 2020, according to CMS performance year 2020 data. CHS, reports that in 2020, the ACC of Southeast Texas achieved the following outcomes:

  • Served more than 18,000 Medicare beneficiaries across southeast Texas;
  • Achieved an overall savings rate of 12.2%, the third highest of all Next Generation ACOs; and,
  • Generated $30 million in shared savings – a 70% increase from performance year 2019.
  • Achieve a 94.6% overall quality score
  • The network has experienced a 20% decrease in inpatient discharges per 1,000 and a 29% decrease in ER visits per 1,000 since 2012.

The Accountable Care Coalition of Southeast Texas has participated in the Next Generation ACO initiative since the program's first performance year in 2016. Performance year 2021 represents that last year of the Next Generation ACO Model. Collaborative Health Systems will be managing four Direct Contracting Entities with a presence across 24 states. CHS currently manages two Next Generation ACOs, one Direct Contracting entity, eight MSSP ACOs, a Care Transformation Organization, and three Independent Practice Associations. CHS is a wholly owned subsidiary of Centene Corporation.

Meanwhile, athenahealth reports their ACO clients "earned a total of $143 million in savings in the 2020 Medicare Shared Savings Program (MSSP)", and among their ACO customers, "81% generated shared savings and 100% avoided losses. In addition, athenahealth’s ACO customers achieved an average quality score of 97.8% for 2020 and earned an average shared savings of $22.59 per member per month (PMPM), which compares to an average of $16.23 for all other ACOs participating in MSSP."

Milliman researchers recently published results of their analysis of ACO characteristics determined to be strongly predictive of MSSP gross savings, comparing current ACO performance analytics to a previous study conducted in 2015.

Milliman researchers found that the drivers of recent success are quite different and, in some cases, the opposite of what they were in 2015. With Pathways to Success, CMS endeavored to reshape the MSSP by adjusting incentives, encouraging greater accountability in ACOs, and offering options specific to each ACO’s ability to take on risk. Their analysis gives early indication that these changes are rewarding ACOs for attained efficiency levels, possibly enhancing the attractiveness of the program. Furthermore, the authors also see evidence of at least some correlation between tracks with downside risk and higher gross savings, supporting CMS’s case for accountability as a policy priority, though voluntary track selection may also be playing a role. Lastly, the authors see some indication that ACOs strongly emphasizing primary care are having greater success than their peers.

The Milliman team involved in this study will be presenting their findings in a new HealthcareWebSummit webinar: Key Drivers of ACO MSSP Results - What Predictive Analytics Can Tell Us, to be held Thursday, November 18th, 2021 at 1PM Eastern.

Friday
Sep102021

Telehealth Going Forward: More Measured, and Featuring Primary Care, Behavioral Health and Chronic Care

By Clive Riddle, September 10, 2021

The Center for Connected Medicine has just released a new report conducted in partnership with KLAS Research:  The Intersection of Value and Telehealth: Survey Findings on Adoption and Utilization, which tells us that “more than a year after many hospitals ended their COVID-19 shutdown of non-emergency care, the use of telehealth for patient visits is leveling off at 20% or less of all appointments.”


The study also found that “more than 80% of survey respondents said one-fifth or less of their organizations’ appointments were being conducted virtually….and of the small number of hospitals and health systems reporting 30% or more of patient volume as virtual, many said they expected that number to decline as the pandemic wanes.”

A previous CCM/KLAS report found 77% of organizations were measuring and analyzing use of telehealth by patients, while “the new survey found 92% reported measuring and analyzing at least one metric” and “about a quarter of respondents reported measuring health outcomes for patients using telehealth in the latest survey, up from 12% who said they were doing so in the 2020 report.”

Here are seven takeaways from their report’s key findings: 

  • There are now fewer telehealth appointments as a percent of total appointments compared to earlier in the pandemic
  • Primary care and behavioral/mental health are the service areas most likely to be using virtual care.
  • Chronic care management is the service area most likely to be expanded in the future.
  • The number of health systems measuring telehealth usage and patient satisfaction has increased
  • The top two barriers to advancing telehealth are patient access to technology/broadband and uncertainty around future reimbursement levels.
  • One-fourth of respondents reported gaps in telehealth integration with their electronic health record system
  • Patient portals and digital front door solutions are the most commonly cited means by which patients access telehealth services.


Thursday
Sep022021

The 2021 Medicare Trust Fund Report by The Numbers

By Clive Riddle, September 2, 2021

What is the state of the Medicare Trust Fund, by the numbers? $900 billion in income and $926 billion in  expenditures provided for the 62.6 million Medicare beneficiaries, with the Part A fund projected to be depleted in 2026, and current running at 4.0% of GDP that will increase to 6.5% before the end of this century.

Earlier this week, the 255-page 2021 Medicare Trust Fund report was released, which of course found that  in 2026  for Medicare Part A, “the fund's reserves will become depleted and continuing total program income will be sufficient to pay 91 percent of total scheduled benefits.”

The supplemental trust fund accounts - Part B and Part D, are "adequately financed into the indefinite future because current law provides financing from general revenues and beneficiary premiums each year to meet the next year's expected costs. Due to these funding provisions and the rapid growth of its costs, SMI will place steadily increasing demands on both taxpayers and beneficiaries."

The fund projections "have been significantly affected by the pandemic and the recession of 2020. Employment, earnings, interest rates, and GDP dropped substantially in the second calendar quarter of 2020 and are assumed to rise gradually thereafter toward full recovery by 2023, with the level of worker productivity and thus GDP assumed to be permanently lowered by 1 percent even as they are projected to resume their pre-pandemic trajectories. In addition, the Trustees also project elevated mortality rates related to the pandemic through 2023 (15 percent for those over age 15 in 2021, declining to 1 percent by 2023) as well as reductions in immigration and childbearing in 2021-22 from the levels projected in the 2020 reports, with compensating increases a few years later."

The report projects that for total Medicare expenditures as a percentage of GDP will increase from 4.0 percent in 2020 to 6.5 percent by 2095.” Here’s a graph of Medicare percent of GDP provided in the report, historical and projected, for this century:

Setting aside fund projections for now, perhaps the item of more immediate interest in the report is the Medicare fund snapshot for the year just completed, providing a view of the $900 billion total fund income, and $926 billion total fund expenditures for 2020, provided for the 62.6 million Medicare beneficiaries:

We compiled the fund benefits for 2020 and 2019, excluding Part C (Medicare Advantage, etc) to provide a comparison of percentage of benefit expenditures by category before (2019) and during (2020) the pandemic. The big change is in the “Other” category, which as the report footnotes “Includes the impact of the Accelerated and Advance Payments Program, which was significantly expanded during 2020 due to the COVID-19 pandemic. Total payments of $107.1 billion were made from the HI trust fund and the SMI Part B trust fund account.” Thus the $99.9 billion increase in “Other” from 2019 to 2020 is explained by these pandemic program payments.

Thursday
Aug192021

Utilization Drop in 2020 May Have Not Been as Much as Feared, and 2021 May be Seeing a Spike

By Clive Riddle, August 19, 2021

Analysis of California Health Plan data indicates 2020 physician encounters and inpatient days didn’t plummet as far as some worried earlier in the pandemic, due to deferred care, although as all aspects of everyday like opened up more in 2021, a spike in utilization was evidenced.  These findings are a preview of the complimentary webinar presentation:  California Health Plans By the Numbers: Key California Health Plan Data and Trends, to be held this Wednesday, August 25th at 10AM Pacific.

California health plan physician encounters per member per year dropped from 2019 to 2020 in all three segment populations: Commercial from 5.1 to 4.4, Medi-Cal from 4.4 to 3.7. and Medicare from 8.4 to 8.4. But all three segment have increased in 2021 through June (5.4, 4.2, and 10.7 encounters respectively), with Commercial and Medicare surpassing 2019 levels. The 2021 jump is even more pronounced compared to the first six months of 2020.

California inpatient days per 1,000 members experience was somewhat similar. Comparing 2020 to 2019, Commercial dropped to 162.0 from 173.0, and Medicare dropped to 676.9 from 708.4. However, Medi-Cal days per 1,000 increased in 2020, to 356.1 to, 327.5. This was likely somewhat due to effects from a marked increase in new Medi-Cal members in 2020 (927k net new members in 2020, almost a 10% increase.) 2021 days per 1,000 increased over 2020 levels for all three segments, and 2021 Medi-Cal and Medicare days were materially higher than 2019.

Come join us this Wednesday to find out more!

Friday
Jul232021

Life Expectancy at Birth in 2020: One Simple Number for COVID-Deniers

By Clive Riddle, July 23, 2021

Deniers of COVID-19's impact - sadly numbering in the millions - posted on social media in droves during the past year that COVID-19 deaths were vastly overstated because they were attributed to other actual causes of death. Countless reports on excess mortality due to COVID-19 have been dismissed by deniers as wonky number manipulation.

Perhaps the CDC’s NVSS Vital Statistics Rapid Release this month of Provisional Life Expectancy Estimates for 2020 will put things into simpler terms for such skeptics. The overall average life expectancy at birth for Americans has gone down. Life expectancy has been tracked as a statistic beyond our lifetimes, and the NVSS report has been released decades before anyone heard of COVID-19. And the report tells us that “in 2020, life expectancy at birth for the total U.S. population was 77.3 years, declining by 1.5 years from 78.8 in 2019.”

Robert Anderson, the Chief of Mortality Statistics at CDC's National Center for Health Statistics states "This is a huge decline. You have to go back to World War II, the 1940s, to find a decline like this." We downloaded the CDC historical data table for 1900-2018, and added in the new 2020 figure to produce this post-World War II chart:

Charts produced in the Rapid Release report also succinctly tell two main messages behind this drop in life expectancy: the cause of the drop (COVID-19) and the disparities of the drop (for minorities). With regard to the cause:

And with respect to changes in life expectancy by race:

Friday
Jul162021

Postcards From the Drug Pricing Trail

By Clive Riddle, July 16, 2021

President Biden’s recently released Executive Order on Promoting Competition in the American Economy included provisions regarding prescription drugs, first stating that “Americans pay more than 2.5 times as much for the same prescription drugs as peer countries, and sometimes much more. Price increases continue to far surpass inflation," and that "these high prices are in part the result of lack of competition among drug manufacturers."

The Executive Order:

  • Directs the Food and Drug Administration to work with states and tribes to safely import prescription drugs from Canada, pursuant to the Medicare Modernization Act of 2003.
  • Directs the Health and Human Services Administration (HHS) to increase support for generic and biosimilar drugs, which provide low-cost options for patients.
  • Directs HHS to issue a comprehensive plan within 45 days to combat high prescription drug prices and price gouging.
  • Encourages the FTC to ban “pay for delay” and similar agreements by rule.

With respect to drug pricing, its interesting that three days before the Executive Order was released, a USC study "comparing Medicare Part D prescription drug prices with those paid by Costco members finds that the federal government overpaid on roughly half of the most common generic medicines in 2018. The findings suggest that policymakers should take a closer look at the practices of intermediaries who effectively negotiate drug prices on behalf of Medicare but don’t necessarily pass on the savings to beneficiaries and taxpayers."

The study: Comparison of Spending on Common Generic Drugs by Medicare vs Costco Members, was published this month in Jama Internal Medicine, and found:

  • Across more than 1.4 billion Medicare Part D claims for 184 products, Medicare plans overspent by 13% in 2017 and almost 21% in 2018 compared to Costco member prices.
  • Medicare plans paid more than Costco members on almost 53% of 90-day fills analyzed in 2018. On all 30- and 90-day prescription fills, Medicare plans overpaid 43% of the time.

On the front lines of the drug-pricing front, GoodRx tracks the manufacturer drug price hikes that happen every year in January and July, and recently published  their update on July 2021 Drug Price Increases. They noted that “last July, 67 drugs increased in price by an average of 3.1%, compared to 2019, when 37 brand drugs increased by an average of 4.3%.” So far this July, they have tracked 64 brand drugs increasing an average of 3.5%; 1 generic drugs increasing 0.3%, for an overall total of 65 drugs increasing an average of 3.5%. Topping the price increase list was Zolpimimist from Aytu BioPharma at 15.9%.

For perspective on individual drug costs from a volume standpoint, the ClinCalcDrugStats Datbase  listing of the top 200 drugs of 2021 by volume is headed by Atorvastatin (cholesterol) which had 112.5 million U.S. prescriptions in 2018, at an average total drug cost of $50.97 per prescription ($1.00 per day of therapy) with covered patients paying an average $7.32 in cost-sharing. Number two was Levothyroxine (thyroid) which had 105.8 million U.S. prescriptions in 2018, at an average total drug cost of $25.14 per prescription ($0.50 per day of therapy) with covered patients paying an average $12.50 in cost-sharing.

But the high volume prescription costs haven’t been the chief driver of overall cost increases for some time. The oft-cited culprit are specialty drugs. One report, released last month:  the AMS 2020 Specialty Drug Trends Report, found that:

  • Fewer than 2% of the U.S. population utilized specialty drugs
  • Specialty drugs account for more than half (51%) of total drug spend
  • 80% of annual medical trend increases were driven by specialty drug costs
  • The top 10 Medicare Part B covered drugs accounted for 2% of all covered products but 43% of total Part B drug spending
Friday
Jun252021

Addressing Mental Health Requires Greater Focus on the Workplace

By Clive Riddle, June 25, 2021

Perhaps no aspect of healthcare is more intertwined with the workplace than mental health. In Health Affairs this week, Amanda Goorin, Richard G. Frank, and Sherry Glied in their post: Addressing Mental Illness Requires Workplace Policy As Well As Health Care Policy, frame a central workplace mental health issue as this:

“Nearly one in five adults, or 51.5 million people, in the United States meets diagnostic criteria for a mental illness, which can impair functioning across a spectrum of severity, ranging from mild to moderate to severe. Yet, despite advances in the diagnosis and treatment of these conditions, and considerable progress on including mental health care in health insurance, people with mental illness—including those with moderate illnesses such as depression or anxiety—continue to be tenuously connected to work and, hence, to full participation in society. Mental illnesses pose difficulties for workers because their symptoms can interfere with essential workplace skills, such as participating effectively in teams, interacting with customers and co-workers, and maintaining concentration.”

The Hartford this week released their 2021 Future of Benefits Study, stating that a “majority of employers recognize employee mental health as a significant workplace issue and report stigma associated with mental illness prevents treatment.” They found “70% of employers now recognize employee mental health is a significant workplace issue, and 72% said stigma associated with mental illness prevents U.S. workers from seeking help. Also, 52% of employers said they are experiencing significant or severe workplace issues due to substance misuse or addiction among their employees.”

Other key findings indicated that employers and workers are divided in key areas about mental health in the workplace::

  • 80% of employers said their company culture has been more accepting of mental health challenges in the past year, but only 59% of workers agree;
  • 79% of employers said they have an open and inclusive environment that encourages a dialogue about mental health, compared to 52% of workers who agree;
  • 77% of employers said leadership at their company encourages conversations about mental health, compared to 56% of workers who agree; and
  • 78% of employers said workers have flexibility in their schedule to get the mental health help they need, but just 58% of employees agree about this flexibility.

Wednesday
Jun162021

Chinese Healthcare and More with Rong Yi

by Clive Riddle, June 16, 2021

MCOL is very excited and please to be welcoming Dr. Rong Yi as a contributor to mcolblog. She is the principal responsible for Milliman’s Greater China Healthcare Analytics Practice, and will be be discussing Chinese Healthcare and more in future periodic posts.

We have just featured Rong in a new MCOL Podcast in which she provides a nice overview of healthcare in China, and how their healthcare issues and system compare and contrast to the U.S. She also provides some background on what led her on her own path with healthcare, analytics, and covering these topics in China.

Please take a listen to this new Pocast, in which I interview Rong, and watch for her future posts: https://www.healthsharetv.com/content/chinese-healthcare-and-more-mcol-podcast-rong-yi

Thursday
May202021

Patients Want Two “T”s From Providers: Telehealth and Texting

By Clive Riddle, May 20, 2021

Results from two surveys were released this week on what U.S. patients want in their provider communications: telehealth and texting.

Harris Poll, on behalf of NextGen Healthcare, found that 53 percent "say the pandemic changed how they want to communicate with their doctor. Notably, nearly half (48 percent) indicate they would switch to a different healthcare provider if their current provider did not offer telehealth appointments." A HIMSS survey sponsored by SR Health found that “patients want more regular and immediate interactions with providers and to be more engaged in their overall healthcare and wellbeing. Nothing is more effective for that kind of communication than text. Ideally, today, every healthcare interaction should begin with a text message.”

The Harris Poll found "an overwhelming majority of U.S. patients who received telehealth services since March 2020 (84 percent) plan to continue using telehealth appointments in the future, citing reasons such as convenience (43 percent) or to avoid being around people who are ill (39 percent)." 57% say they would be more likely to get follow-up medical care if telehealth appointments were an option.

But beyond telehealth, the Harris Poll also addressed overall online access to providers. 58% of patients stated they want online access to their healthcare provider. Age plays a role in this: Patients from 18-54 are significantly more likely than patients 55 and older to say they would like to have more online access to their healthcare provider (68% under age 55 and 43% age 55+.) The wish list includes:

  • online appointment scheduling (49 percent)
  • ability to check-in or complete health forms/appointment paperwork online before an appointment (49 percent)
  • online prescription management (48 percent)
  • online medical records access (47 percent)

The HIMSS survey report: “Patient Communication Preferences in 2021,” concludes that "since the pandemic began, more regular communication is expected from healthcare providers. During the pandemic, emailing and texting healthcare providers has increased with almost half of patients saying they prefer to communicate with healthcare providers via text.”

Their survey found that:

  • Overall, 65 percent of people would like to receive healthcare text messages.
  • Text communication rose by 14 percent during the pandemic.
  • Eighty-seven percent of respondents said convenience was the reason they prefer messaging with providers.
  • More than one-third of patients would be willing to switch providers to receive more modern communication like real-time text messaging.
Friday
Apr092021

Springtime in Medicare Advantage Land

By Clive Riddle, April 9, 2021

The seeds are planted in the fall. Then as Spring arrives, you can assess what has been sowed.  Or, as Mark Farrah Associates puts it: “Health insurers compete by offering new pricing and product options to beneficiaries during the Open Enrollment Period for Medicare Advantage (MA) and prescription drug plans (PDPs), that runs from October 15th through December 7th of each year. Plans then begin to analyze final enrollment results in February and March to evaluate their standing and assess which competitors gained and lost members.”

Here's a summary of MA and PDP enrollment that appeared two weeks ago in MCOL’s HealthExecSnapshot:

Mark Farrah Associates has just released their analysis of March 2021 MA and PDP enrollment. They report that “as of March 1, 2021, total Medicare Advantage (MA), including Medicare Advantage with Prescription Drug Plan (MA-PD) membership, stood at 27,158,911 with a net gain of 2,408,192 members from March 1, 2020.  Medicare stand-alone prescription drug plans (PDPs) covered 24,268,611 members as of March 1, 2021, a net decrease of 926,333 from the previous year....MA plans grew by 9.7% while there was a -3.7% decrease for PDPs, year-over-year.”

They also note that:

  • The top ten carriers covered 77.6% of all MA enrollees, with UnitedHealth remaining the market-share leader.
  • Texas experienced the most sizeable year-over-year increase of almost 208,000 MA members.
  • Stand-alone PDPs experienced a decrease of approximately 926,000 enrollees between March 1, 2020 and March 1, 2021.
  • CVS, UnitedHealth, and Centene were the leaders amongst the top five companies that control 87% of the PDP market

Here are the top five national MA plans with their total March 2021 enrollment, % growth over March 2020. and national marketshare, from the Mark Farrah Associates report:

1. UNITEDHEALTH  | 7,221,432  | 13.7%  Growth | 26.6% Marketshare

2. HUMANA | 4,854,260 | 8.9%  Growth |17.9% Marketshare

3. CVS | 2,860,379  | 9.2%  Growth |  10.5% Marketshare

4. KAISER | 1,740,733 | 3.5% Growth |  6.4% Marketshare

5. ANTHEM | 1,530,894 | 15.4% Growth |  5.6% Marketshare

And here are the top five national PDPs from the Mark Farrah report:

1. CVS  | 5,738,786  | 1.0% Growth | 23.6% Marketshare

2. UNITEDHEALTH | 4,507,985 | -7.0% Growth |18.6% Marketshare

3. CENTENE | 4,131,374 | -6.5% Growth |17.0% Marketshare

4. HUMANA | 3,556,348 | -5.9% Growth |14.7% Marketshare

5. CIGNA | 3,194,589 | -3.3% Growth |13.2% Marketshare


Friday
Apr022021

Tracking COVID-19 Vaccination Enthusiasm and Hesitancy

By Clive Riddle, April 2, 2021

The monthly Kaiser Family Foundation COVID-19 Vaccine Monitor report released this week "finds enthusiasm for getting a COVID-19 vaccine continuing to grow, with roughly 6 in 10 adults (61%) now saying they have already gotten at least one dose (32%) or want to get vaccinated as soon as they can (30%)." KFF tells us "that’s up from a combined 55% in February and 47% in January, as more people report getting vaccinated and fewer say they want to “wait and see” how the vaccine works in others before getting it themselves (17% now, compared to 22% in February and 31% in January)."

The report finds that most people now know how to navigate the vaccine system: “For the first time, a majority of those who have not yet been vaccinated say they have enough information both about where (67%) and when (53%) they can get vaccinated, though the report also finds a sizeable minority that lacks key vaccine information.

For those still unsure how to navigate or if they are eligible, the report states “the share that is uncertain is highest among Hispanic adults (45%), those under age 30 (39%), with annual household incomes under $40,000 annually (37%), and those without a college degree (35%).”

KFF launched their Vaccine Monitor in December, tracking who has received the vaccine, would get one asap, or listed their degree of hesitancy. Previously, surveys were more hypothetical,  asking if they were somewhat or very likely to receive the vaccine We tracked selected surveys during the past year asking that question, indicating a trend of initial enthusiasm a year ago, waning acceptance as the year progressed until the rollout became more imminent, when acceptance picked back up again – just as in Kaiser’s more recent surveys now that actual vaccinations are taking place.

April 2020

May 2020

July 2020

August 2020

September 2020

October 2020

November 2020

December 2020

January 2021

February 2021

What about those disinclined to be vaccinated? What is their state of mind? The Pew February 2021 study included this listing of reasons for those disinclined to take the vaccine:

  • Concerned about side effects 89%
  • Vaccines developed/tested to quickly 85%
  • Want to know more about them 80%
  • Too many vaccine mistakes in past 74%
  • Don't think I need it 68%
  •  Decline vaccines in general 57%

This compares to these reasons listed in the March 2021 KFF report:

  • Might experience serious side effects 70%
  • Effects of the vaccine will be worse than getting COVID-19 63%
  • Might be required to get vaccine even if you don't want to 63%
  • Might miss work if side effects make you feel sick 45%
  • Might get COVID-19 from the vaccine 39%
Friday
Mar192021

Humana and the Payer-Agnostic Circle of Life

By Clive Riddle, March 19, 2021

Humana on Saint Patty’s Eve announced their new brand – CenterWell – “to describe and connect a range of the company’s payer-agnostic health care services offerings.”  Their senior-focused primary care facilities, including the multi-state Centerwell Primary Care, and Florida based Family Physicians Group will be included under the brand.

Centerwell will ultimately encompass Humana’s other health care services as well. Humana notes that in recent years it has “significantly expanded its health care services capabilities – from primary care to pharmacy to home care and more – in order to better serve its medical members, and to significantly strengthen its payer-agnostic care offerings. Now, the company is taking the next step with plans to unite various payer-agnostic services under the new CenterWell brand.”

“Payer-agnostic” is not a new term. A 2013 New England Journal article Payer Agnosticism, comes to mind, for example. But Humana has certainly been advancing the term to a whole new level during the past year, deploying the term seven times in their mpst recent announcement.

In January, during another “payer-agnostic” company announcement, Humana unveiled plans to open twenty more primary care centers during 2021, five more than in 2020; bringing the total Partners in Primary Care locations to 80 with a goal of 100 center by 2023.

The payer-agnostic approach for differs from a classic clinically integrated model in that the owned health care services are promoted and provided to serve multiple payers, instead of just the payer-owner. But never-the-less, it is interesting to see the Humana’s “circle of life” evolution of strategy of a healthcare provider turned health plan, now turned health plan / healthcare provider:

  • 1972 - Founders David Jones and Wendell Cherry sold their nation’s largest nursing home company to capitalize acquiring hospitals
  • 1974 – The new hospital company corporate name is changed to Humana
  • 1984 – Humana starts its own health plan operations, as do other national hospital chains
  • 1993 – Humana spins off its 77 hospitals to create Galen Health Care, similar to spin-off moves previously taken by other national hospital chains. But unlike they other chains, they spun of the hospitals as opposed to the health plans.
  • 1994 – Galen Health Care is sold to Hospital Corporation of America (HCA)
  • 2015 – Aetna acquisition of Humana is announced, but then falls apart over the next 18 month.
  • 2018 – Humana participates with two private equity firms in acquisition of Kindred Healthcare.  Humana merges four owned Florida clinics from separate previous integrated plan acquisitions into one operating unit that will also service non-Humana patients
  • 2020 - $600 million deal with New York-based private equity firm Welsh, Carson, Anderson & Stowe is announced to capitalize growth of Partners in Primary Care
Thursday
Mar042021

Medicaid Plan Risk Adjustment: A Dime Yields $15

By Clive Riddle, March 4, 2021

Sherlock Company’s March issue of Plan Management Navigator tackles the topic of Medicaid risk adjustment expenses and premiums pmpm. Their analysis attempts “to measure the efficacy of risk adjustment expenses on premium rates” for Medicaid plans; because “as a result of the increased population of Medicaid members, there is a growing need to accurately capture risk scores so that compensation to the plan is commensurate with their health care requirements.”

So what exactly is “risk adjustment” in this Medicaid plan context? They explain “the Sherlock Benchmarks define Risk Adjustment as the expenses associated with the analysis of clinical data in order to match government compensation with the risk factors of members. This includes adjustment for the “three Rs”: permanent risk adjustment, transitional reinsurance and transitional risk corridors. For Medicaid products, this includes activities such as those supporting Chronic Illness and Disability Payment System (CDPS) system. Activities in this function include determining which members should be moved from TANF to higher capitation products.”

Their analysis is based on data from the Sherlock Benchmarks 2020 edition, which segments costs according to 70 functional or sub-functional categories. They captured risk adjustment chart review metrics including: total chart reviews, total charts subject to multiple passes, the risk score improvement percentage, and the dollar reimbursement yield.”

Their findings? “The modeled regression line implies that every $0.10 PMPM spent in Medicaid HMO Risk Adjustment results in about $15.00 PMPM in additional premiums. To put this in perspective, of the 14 plans included in this analysis, no plan spent over $1.50 PMPM in Risk Adjustment expenses.”

Not a bad ROI.

By the way, President Doug Shlock says there is always room for more plans to participate in their 2021 benchmarking study. Interested plans can contact Doug at sherlock@sherlockco.com.

Friday
Feb122021

Influenza Joins The 1%ers – The One Bit of Good COVID News

By Clive Riddle, February 12, 2021

It’s been widely discussed that influenza spread this flu season is significantly lower, due in great part to COVID-19 induced mask wearing, hand washing, physical distancing and reduced travel by a good portion (but certainly not all) of our population.  

Now that we’re progressing through this influenza season, it’s interesting to do a side-by-side comparison for 2021 vs 2020 as of week five of the calendar year (40 cumulative weeks for the flu season).

Summing up the numbers from the CDC Weekly Surveillance Report totals through the 40th week of the season for both years, here’s the jaw-dropping difference:

  • 2019-2020 Positive Cases through Week 40: 129,997
  • 2020-2021 Positive Cases through Week 40:    1,364
  • 2019-2020 Flu Test Positivity Rate through Week 40: 17.6% (738,331 tests)
  • 2020-2021 Flu Test Positivity Rate through Week 40:   0.2% (593,570 tests)

So this season’s positive cases of influenza are running at 1% of last season!

Comparing the CDC Weekly Surveillance Report charts for these two snapshots in time, stark as the difference appears, actually doesn’t do the comparison justice as the scale for the current season had to be changed for the graph to be readable (the y axis grid for number of positive specimens is in increments of 50 for the 2020-2021 season, vs increments of 2,000 for the 2019-2020 season.)